- Home
- :
- All Communities
- :
- Products
- :
- ArcGIS Dashboards
- :
- ArcGIS Dashboards Ideas
- :
- Include blank values for a serial chart in Dashboa...
- Subscribe to RSS Feed
- Mark as New
- Mark as Read
- Bookmark
- Follow this Idea
- Printer Friendly Page
- Report Inappropriate Content
Include blank values for a serial chart in Dashboard
- Mark as New
- Bookmark
- Subscribe
- Mute
- Subscribe to RSS Feed
- Permalink
- Report Inappropriate Content
In the serial chart widget in ArcGIS Dashboards, the only values represented are from existing features. I would like to be able to have a 'blank', or zero, value for features in the serial chart. Typically, these values would pull from a domain (or a drop-down list) of potential features.
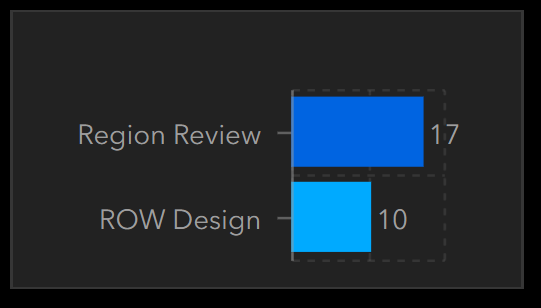
For an example, this is how my serial chart looks now, filtered, to show two values:
If I wanted to add a third value that had no features, I would like for it to look something like this:
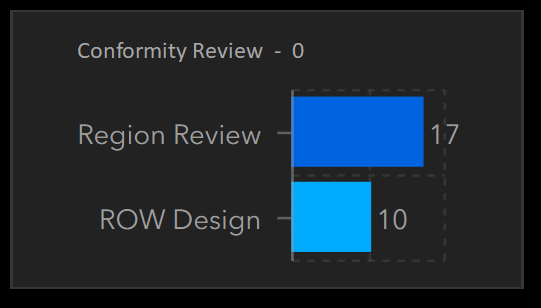
Which I know is a bad drawing but hopefully you get the idea!
Here is the original thread that discusses this:
https://community.esri.com/thread/255547-including-blank-values-for-a-serial-chart-in-dashboard
- Mark as Read
- Mark as New
- Bookmark
- Permalink
- Report Inappropriate Content
This would be useful for my dashboard in ArcGIS Dashboards too as I have it fed by a site safety inspection survey created in ArcGIS Survey123 and having blank values in a chart widget would allow me to show vehicles that hadn't been inspected for a specified time period.
operations dashboards #arcgis survey123
- Mark as Read
- Mark as New
- Bookmark
- Permalink
- Report Inappropriate Content
I'd like this too!

The first graph shows the complete distribution of a dataset. The second is when I had used the category selector to query a particular neighbourhood. It'd be great if we've the option to keep the category axis the same. Thanks!
- Mark as Read
- Mark as New
- Bookmark
- Permalink
- Report Inappropriate Content
I would have thought it would be quite critical to have the option to include items with zero value, especially when creating a dashboard from a survey. If you ask a question and no one selects a specific answer, the lack of selection for the specific answer would be an important data to include in the survey results.
I have a survey which asks the respondents to rate the ease-of-use of a process. Zero respondents have selected 'very difficult', which I would like to show in the dashboard - but the inability to show this data makes the end result appear like I did not include it as a selection option.
- Mark as Read
- Mark as New
- Bookmark
- Permalink
- Report Inappropriate Content
Making a dashboard display something for null data instead of displaying nothing at all can be achieved by using an Arcade expression. More specifically, the "DefaultValue" function does this by assigning a value of your choosing to a piece of data with a null entry.
From my perspective as a total layman to coding, it makes absolutely no sense such a useful setting would require coding to enable. It took me a couple hours of research and ESRI coursework as well as corresponding with multiple coworkers to make an indicator display this tiny piece of info whereas it would take someone already affluent in Arcade mere moments to tailor an indicator in this manner. If this were a built-in feature of the dashboard editing UI there would be no detriment to the workflow of either party.
- Mark as Read
- Mark as New
- Bookmark
- Permalink
- Report Inappropriate Content
There is a workaround I came up with. Take a look at this thread response:
- Mark as Read
- Mark as New
- Bookmark
- Permalink
- Report Inappropriate Content
There are times when records in a table may have NULL as the value, but in the context of a Dashboard, it is appropriate use case to display 0 to represent no records.
Having an option in configuring the dashboard to display NULL as 0 would be beneficial in this scenario.
- Mark as Read
- Mark as New
- Bookmark
- Permalink
- Report Inappropriate Content
Dashboard element will only show information from data/rows that exists in the data source (and won't show, for example, information from rows that might exist such as the case would be where a domain code exists but there is no data for it). With that in mind, I think the examples given in this thread can be handled via a data expression. How the data expression's returned FeatureSet is constructed will depend on the dashboard's needs. See: https://doc.arcgis.com/en/dashboards/get-started/create-data-expressions.htm
The example where a serial chart's columns are to reflect a full set of domain codes would involve using the Domain() Arcade function to get all the domain code description. Then a GroupBy() could be don't to calculate summary statistics. The returned FeatureSet would combine the results of the Domain() call and the GroupBy() call and look something like this:
| Domain Code | Value |
| Conformity Review | 0 |
| Region Review | 17 |
| ROW Design | 10 |
Please note: Some of the other ideas in this thread will require a more involved data expression
You must be a registered user to add a comment. If you've already registered, sign in. Otherwise, register and sign in.