- Home
- :
- All Communities
- :
- Products
- :
- ArcGIS Dashboards
- :
- ArcGIS Dashboards Ideas
- :
- Dynamic Title and Description in Indicators and Ch...
- Subscribe to RSS Feed
- Mark as New
- Mark as Read
- Bookmark
- Follow this Idea
- Printer Friendly Page
- Report Inappropriate Content
Dynamic Title and Description in Indicators and Charts
- Mark as New
- Bookmark
- Subscribe
- Mute
- Subscribe to RSS Feed
- Permalink
- Report Inappropriate Content
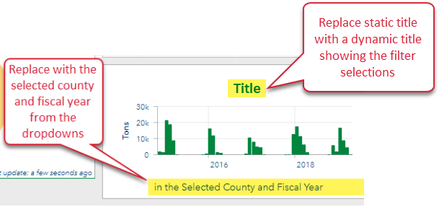
Add the ability to include dynamic values in the title and description of indicators and charts, based on selected filter criteria. For example, if an indicator or chart is filtered by a particular county, then the name of that county should be displayed in the title or description.
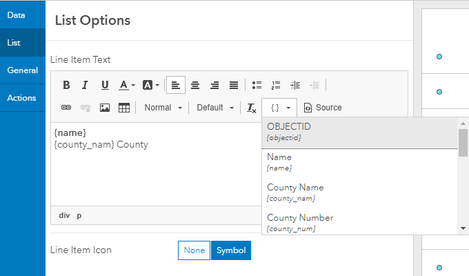
Lists have a way to show data from a field and this concept should be added to the Title and Description controls for indicators and charts.
- Mark as Read
- Mark as New
- Bookmark
- Permalink
- Report Inappropriate Content
YES! I am currently developing a Dashboard for use by a number of stakeholder agencies. The first thing they will do is filter the map, serial charts, pie charts and table by their agency name, using the filters I have added to the Dashboard Header (not using individual filters in each element). They will filter on Fiscal Year and some other variables using the filters in the header. I want the titles or descriptions of the charts and tables to reflect their filtered selection. This will give my users more confidence that the numbers they are looking at reflect their selection set.
It would be even better if this "dynamic title" could be used to name the downloaded excel file the user can generate from the filtered charts and tables.
- Mark as Read
- Mark as New
- Bookmark
- Permalink
- Report Inappropriate Content
Yes! We have a need for dynamic titles. Our data sensors are being moved to different locations and we need the titles to reflect the current locations of the sensors, currently a field in the featureset. Also, our end users are filtering the data and we need the titles to reflect these filters.
- Mark as Read
- Mark as New
- Bookmark
- Permalink
- Report Inappropriate Content
We need this feature to show titles for filtered data
- Mark as Read
- Mark as New
- Bookmark
- Permalink
- Report Inappropriate Content
Adding my name to the list along with a kudos 👍 .
A work-around for this is to:
- Add a List as a row just above the chart and/or table (you can choose to group items);
- From the List properties, Data menu, set the Maximum features displayed to '1';
- Set the Data Layer of the List to the same layer shown in the chart/table;
- From the List properties, Actions menu, set a Filter for both the List with the option to "Render only when filtered" and the chart (do not check box next to "Render only when filtered' for the chart).
When user clicks on the list item, the chart will update to reflect data for the location and the chart title will reflect location selected.
- Mark as Read
- Mark as New
- Bookmark
- Permalink
- Report Inappropriate Content
Thanks JamesShively for this Workaround. It works!
In any case, it would also be useful for me to have the possibility to enter a variable title in the Dashboards.
You must be a registered user to add a comment. If you've already registered, sign in. Otherwise, register and sign in.

