ArcGIS Dashboards Blog

cancel
Showing results for 
Show  only  | Search instead for 
Did you mean: 

Other Boards in This Place

Latest Activity

(74 Posts)
JenniferAcunto
Esri Regular Contributor

Tips and tricks for adding embedded content to your ArcGIS Dashboards from a professional dashboard builder.

Read more...

more
3 0 793
JenniferAcunto
Esri Regular Contributor

Learn when to use bar charts in your ArcGIS Dashboards, as well as best practices from a "professional dashboard builder". 

Read more...

more
5 1 1,755
jcarlson
MVP Esteemed Contributor

Plus a custom linebreaking function for long strings!

Read more...

more
4 4 1,560
NooraGolabi
Esri Contributor

Learn what you need to do to prepare for the retirement of ArcGIS Dashboards Classic.

Read more...

more
1 1 874
jcarlson
MVP Esteemed Contributor

Trick bar charts into being something a little different.

Read more...

more
9 4 2,927
jcarlson
MVP Esteemed Contributor

Here at the Esri Midwest User Conference, @DerekLaw gave an excellent session about administering Enterprise, and talked about the different ways to monitor and track your Portal and its services. Really great stuff to know about.

But for you admins out there, there's often another aspect you need to keep track of: custom scripts. If your organization is like mine, you have some repetitive tasks that you've offloaded to some scheduled Python script. You might also have your script running on some other machine than your primary workstation.

Python's built-in logging is great, don't get me wrong. But sometimes, I really just want to get at my logs without having to remote into some other machine or find the log file. You may already have something in place tracking your logs and giving you some kind of notices or warnings. For me, I am always on my Portal when I'm working, and I wanted to leverage the tools I already had.

So I built a Dashboard. Well, and some other things. This project relies on three key parts:

  1. A hosted table
  2. A dashboard
  3. A custom python function (though this one's optional)

The End Product

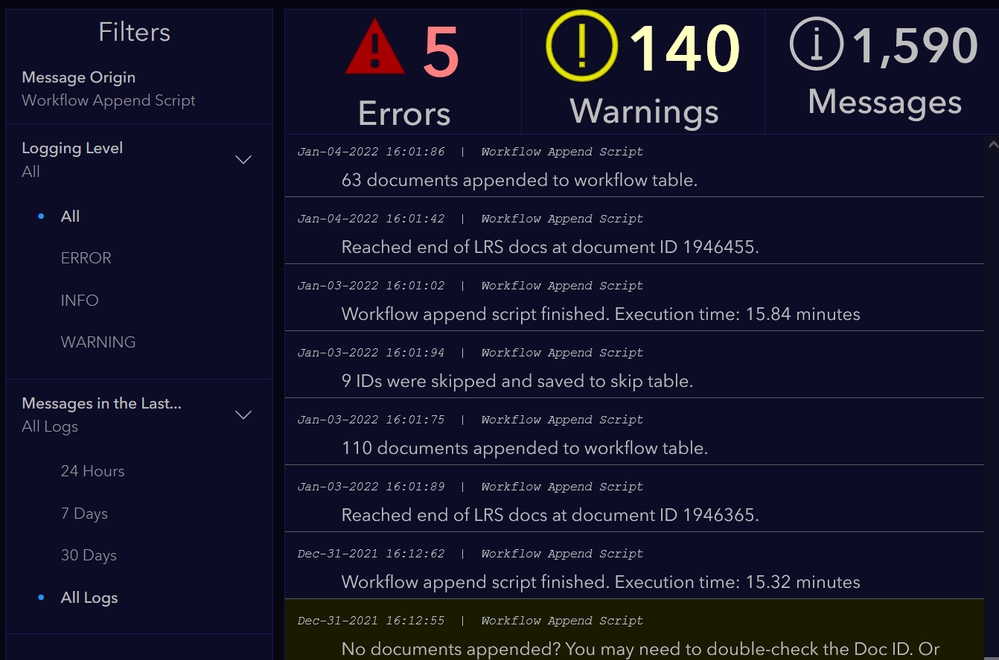
Last things first, let me just show you the end product. If you like the idea, then feel free to read the rest of this to make your own.

jcarlson_0-1647625735165.png

I have an admin-only dashboard that shows me recent logs generated by my scripts. I can use Dashboard's tools to quickly filter the dashboard by message origin, log level, and predefined time ranges. I use features like Advanced Formatting in my List and Conditional Formatting in my indicators to give me a quick, at-a-glance overview of what's going on with my scheduled Python scripts, all in a dashboard simple enough to easily embed elsewhere.

If you like this idea, copy it! Here's how:

The Hosted Table

Create a hosted table in your Portal. At minimum, you'll need:

  • A long-ish text field to hold the message
  • A 'level' field to differentiate between the kinds of messages
    • I prefer to use a coded domain with integers, but do what you like
    • Define whatever logging levels apply to you. I only needed three: "FYI", "Heads up", and "Something broke!" If you need more logging levels, add them!
  • A date field for when the log was generated
    • You can simply enable editor tracking and the created_date field can function as this, and you don't have to bother with specifying its value. That's what I do, which is why you won't see a "timestamp" field being defined below.

Once you've created it, make note of the item ID.

Python Function

You don't need a custom function to do this, but it makes it very easy to send log messages if you do. This makes use of the ArcGIS Python API. At the top of your script, include something like this:

from arcgis import GIS

# Log in to portal, connect to log table and define origin
gis = GIS('your portal url', 'username', 'password')
log = gis.content.get('log-itemID').tables[0]
origin = 'Your Script Name'

# Logging function
def log_add(message, level='INFO'):
    log.edit_features(
        adds=[{
                'attributes': {
                    'origin': origin,
                    'level': level,
                    'message': message
                }
            }]
    )

 With that set up, you can send messages to your log table any time you need.

if something_bad:
    log_add('This part of the script broke.', level=2) #or whatever level corresponds to 'ERROR' in your table.

if something_concerning:
    log_add('The result from this section was unexpected.', level=1)

log_add('Some standard information.')


The Dashboard

The dashboard portion of this is pretty simple. You could probably figure it all out from the screenshot above. Just connect to your log layer in a new dashboard and create a List. I'm on Enterprise, so I don't get those fancy Table widgets yet, but you AGOL users, go for it!

To include some nicer formatting in your list, check out this Arcade expression:

// Format the timestamp
var log_time = Text($datapoint['created_date'], 'MMM-DD-YYYY HH:MM:SS')

// Set background color based on log level
var bgcolor = Decode(
    $datapoint['level'],
    1, '#1a0000',
    0', '#1a1a00',
    '')

return {
    backgroundColor: bgcolor,
    attributes: {
        log_time: log_time
    }
}

Once you have your list, then you just need some filters so that you can quickly zero in on the logs you want. That's pretty standard Dashboard work, so I won't bother elaborating on it here.

And that's it! Now you've got one central location for all your script logs, and you can access it from any device!

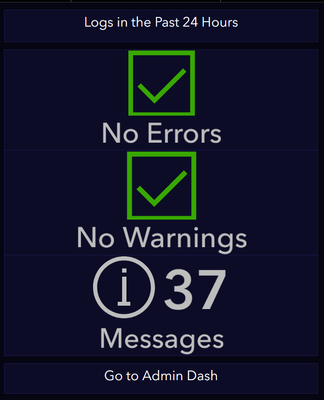
If you want to take things a step further, you can make a mini-version of the dashboard for viewing on mobile, or for embedding elsewhere.

jcarlson_2-1647628979505.png

Include a handy link to the full dashboard, and you can get into the logs if you see anything pop up that needs attention.

more
8 1 1,025
by Anonymous User
Not applicable

This scenario uses Arcade to join two datasets with a data expression: A hosted feature service of "Zones" and a hosted feature service of survey data that shares a common ID with the Zones in a 1-M relationship.

Read more...

more
6 2 3,273
DavidNyenhuis1
Esri Contributor

Learn how to copy a dashboard to see how it was made.

Read more...

more
26 15 48.3K
256 Subscribers
Labels