- Home
- :
- All Communities
- :
- Products
- :
- ArcGIS Business Analyst
- :
- ArcGIS Business Analyst Questions
- :
- Re: Is there a way to add a flow graphic in busine...
- Subscribe to RSS Feed
- Mark Topic as New
- Mark Topic as Read
- Float this Topic for Current User
- Bookmark
- Subscribe
- Mute
- Printer Friendly Page
Is there a way to add a flow graphic in business analyst infographic (online version)
- Mark as New
- Bookmark
- Subscribe
- Mute
- Subscribe to RSS Feed
- Permalink
- Report Inappropriate Content
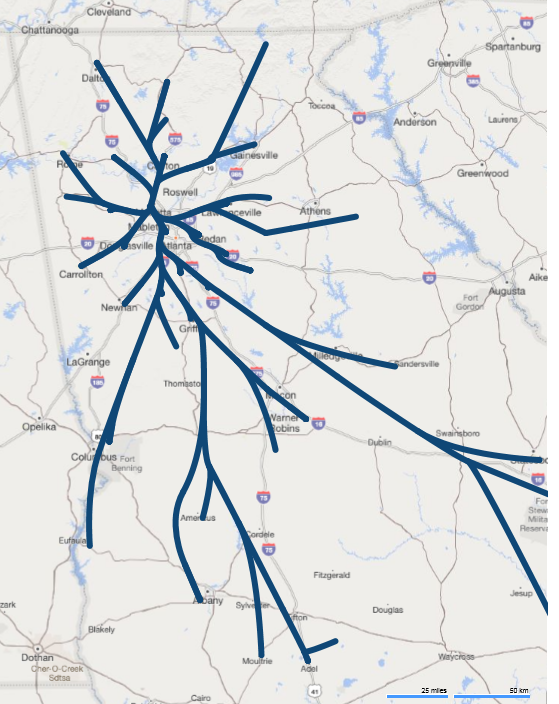
Hi. The infographic in Business Analyst (online) has been working well for us but we manually add a flow graphic to the pdf export to tell part of our story. It would be helpful if we could include a flow graphic as one of the infographic widgets. Is this possible? I believe this kind of graphic is available in ArcGIS Pro. Attached is an example we are producing now in PowerBI. The graphic shows a starting geo-location and ending geo-location and maps the number of flow instances with line thickness.
Solved! Go to Solution.
Accepted Solutions
- Mark as New
- Bookmark
- Subscribe
- Mute
- Subscribe to RSS Feed
- Permalink
- Report Inappropriate Content
Hello Jack,
You should be able to add web maps that contain your flow graphics to your infographic template. Here is a simple example:
You can create a web map with this type of flow graphics in arcgis.com or in ArcGIS Pro and simply add that web map to your infographics. These maps are fully interactive once you add them to the template. Here is a sample web map I created in ArcGIS.com: http://www.arcgis.com/home/webmap/viewer.html?webmap=519b9b590f624790a941ede61f5b6b79
Here is the help doc on creating web maps: Web maps—ArcGIS Online Help | Documentation
I hope this helps!
Fasil T.
Business Analyst Team
- Mark as New
- Bookmark
- Subscribe
- Mute
- Subscribe to RSS Feed
- Permalink
- Report Inappropriate Content
Thanks, Fasil! Very helpful.
- Mark as New
- Bookmark
- Subscribe
- Mute
- Subscribe to RSS Feed
- Permalink
- Report Inappropriate Content
Hi Fasil -- for my Business Analyst use case, I need 15 or so county flow maps. Is there a way to load the flow map based on the site location data of my infographic? ie, when specifying a site address in Cobb County, load the Cobb County flow map? Or do I need to create each map in ArcGIS, then load it manually in the infographic?
- Mark as New
- Bookmark
- Subscribe
- Mute
- Subscribe to RSS Feed
- Permalink
- Report Inappropriate Content
Hi Jack,
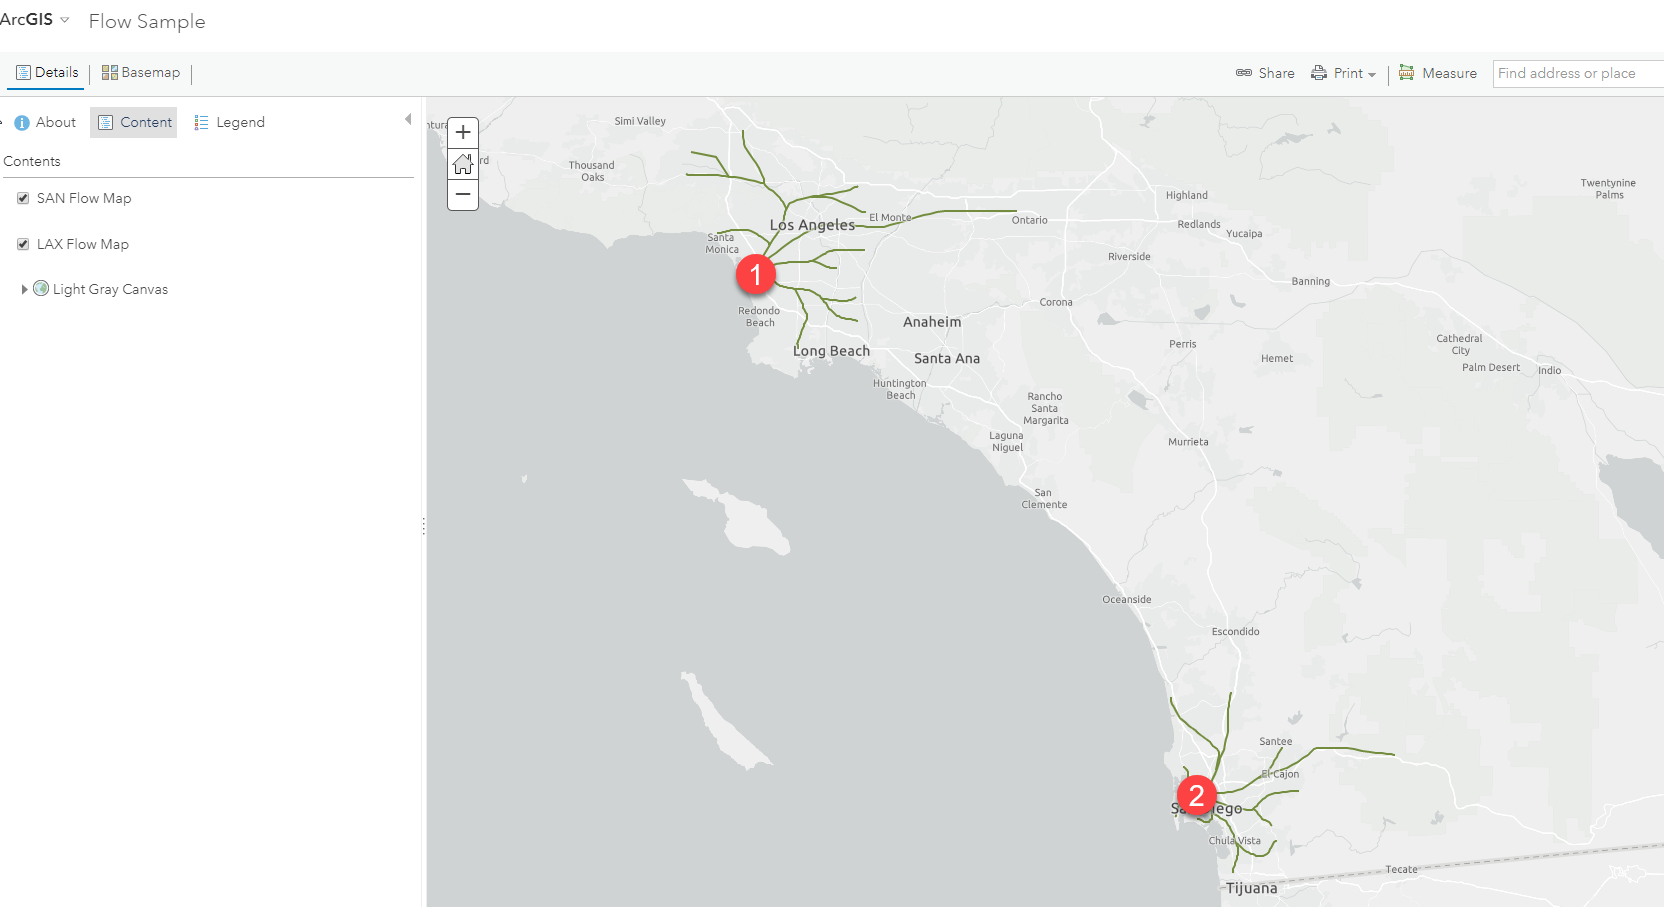
Yes, this is possible as long as your web map contains all the flow map layers. For example here, I have a web map that contains two flow maps (one in LAX and the other in SAN)
http://www.arcgis.com/home/webmap/viewer.html?webmap=519b9b590f624790a941ede61f5b6b79
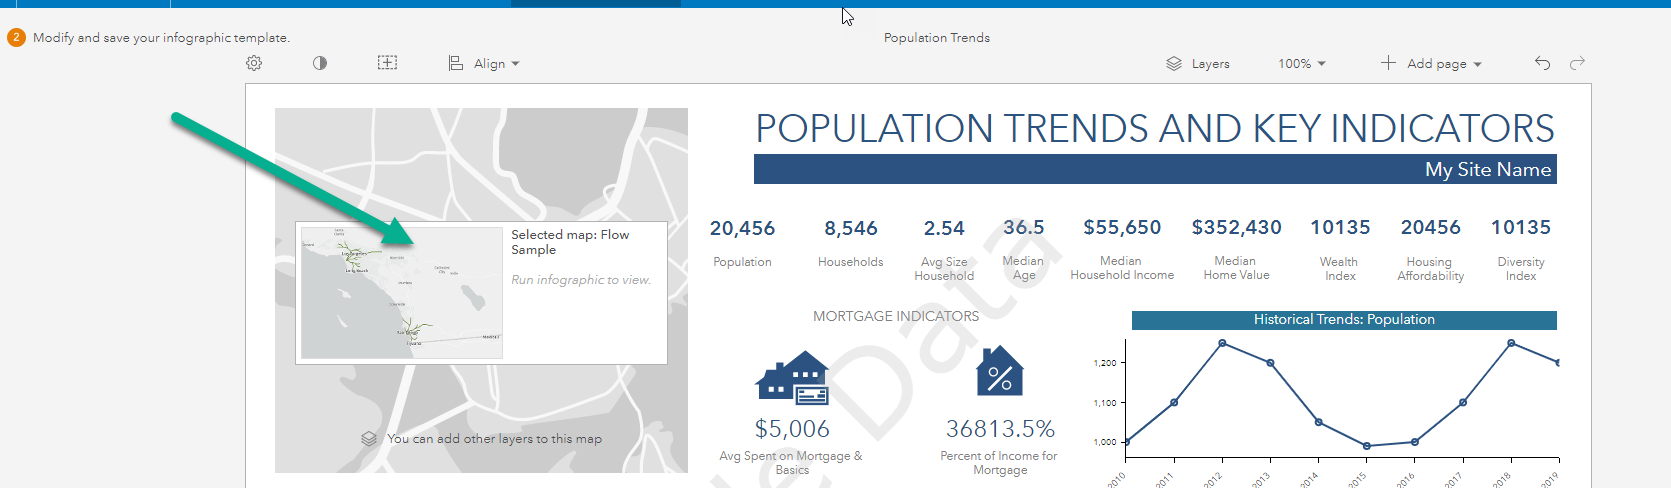
When I build the infographics, I will simply add this web map by browsing to ArcGIS:
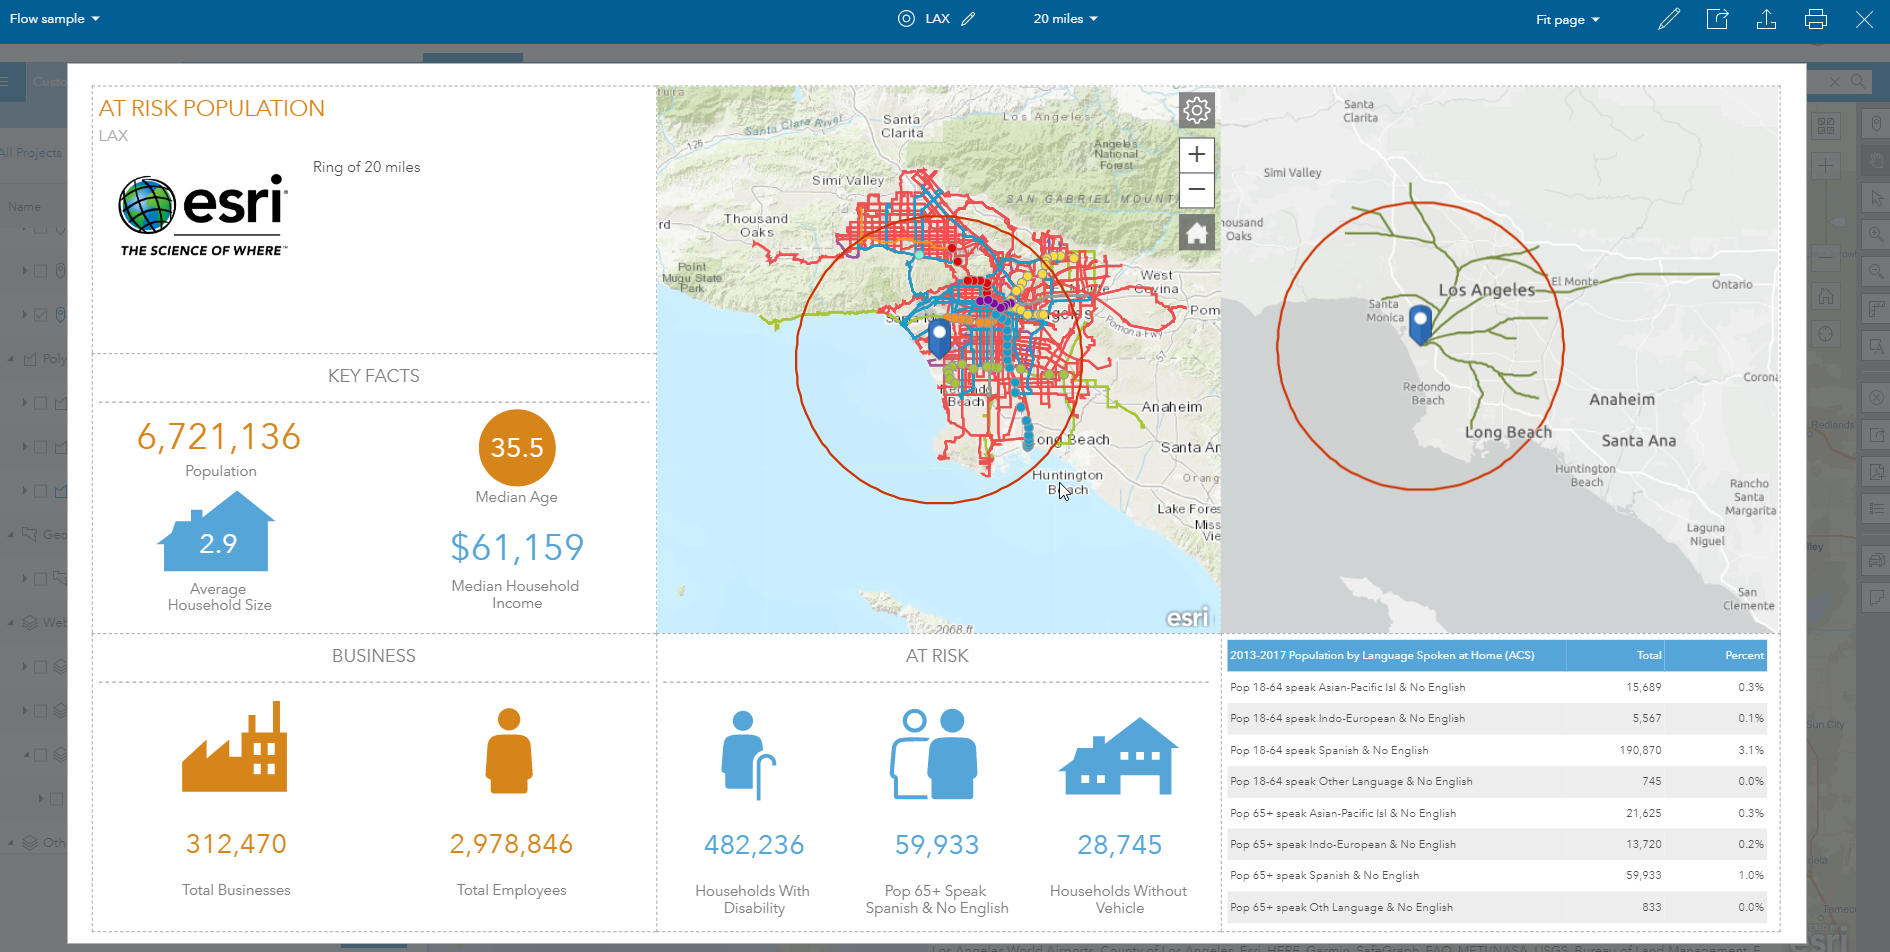
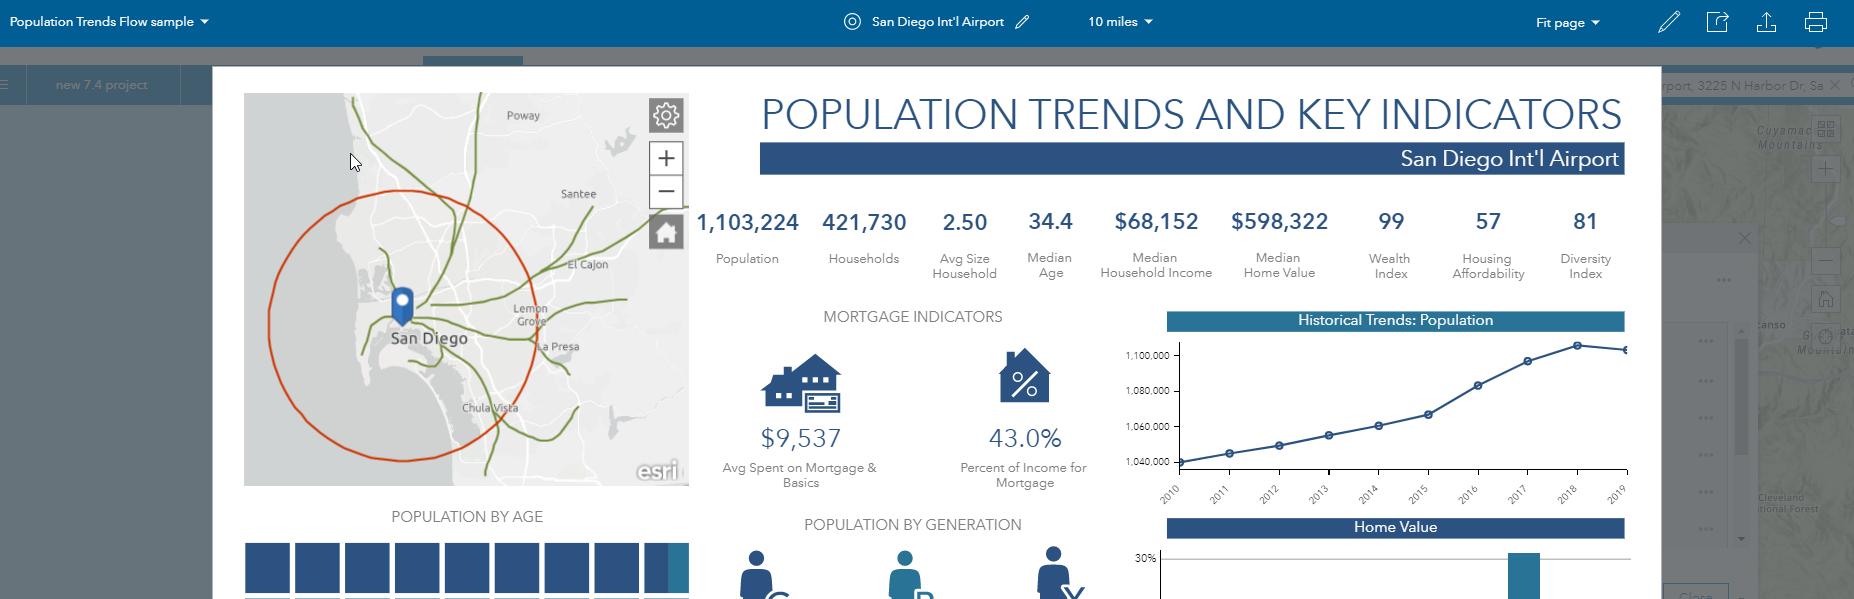
Then, when I run this template for a site in LAX, the infographic will show the flow map within that site extent as follows:

And when I run the same report on a site near SAN, I get the flow map in that area:
I hope this is helpful.
Fasil T.
Business Analyst Team
- Mark as New
- Bookmark
- Subscribe
- Mute
- Subscribe to RSS Feed
- Permalink
- Report Inappropriate Content
Hi. Thanks for the quick response. This is a great solution for sites that are far apart. The sites in my use case have overlapping flow lines (see image). I suppose could manually create individual flow maps for the 15 key counties of interest and build an infographic template for each county. Is there a faster way to create individual maps? Programmatically? 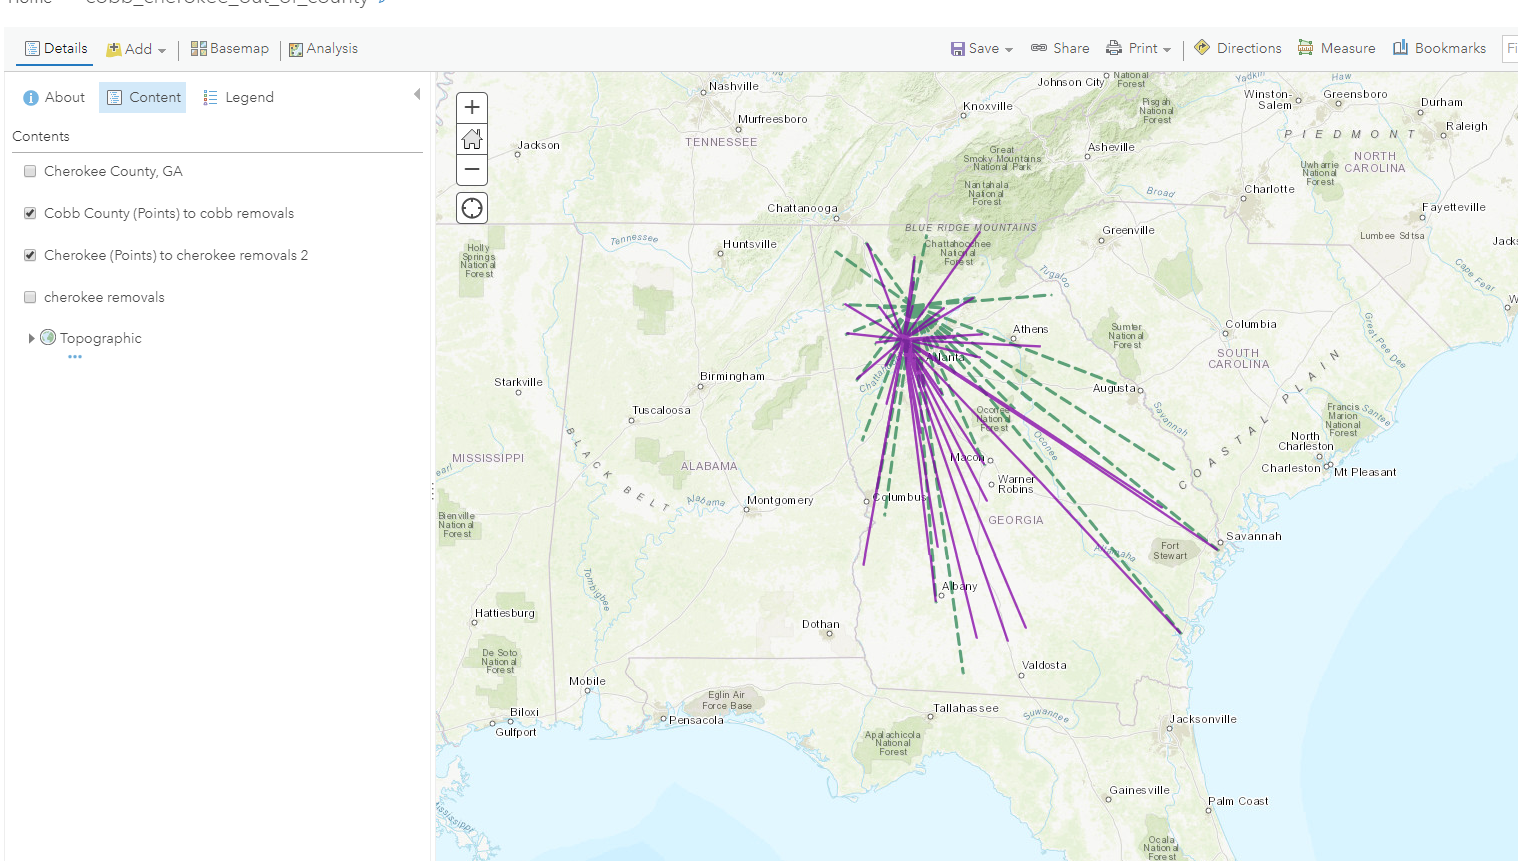
- Mark as New
- Bookmark
- Subscribe
- Mute
- Subscribe to RSS Feed
- Permalink
- Report Inappropriate Content
That would be a great question to post in the ArcGIS REST API or https://community.esri.com/community/gis/web-gis/arcgisonline community.
I hope your solution works out for you.
Fasil