- Home
- :
- All Communities
- :
- Developers
- :
- JavaScript Maps SDK
- :
- JavaScript Maps SDK Questions
- :
- property color of SimpleFillSymbol does not work
- Subscribe to RSS Feed
- Mark Topic as New
- Mark Topic as Read
- Float this Topic for Current User
- Bookmark
- Subscribe
- Mute
- Printer Friendly Page
property color of SimpleFillSymbol does not work
- Mark as New
- Bookmark
- Subscribe
- Mute
- Subscribe to RSS Feed
- Permalink
- Report Inappropriate Content
Hi.
I have problem with the color property of SimpleFillSymbol in some polygons it works and in others not, what can you be? shipping part of the code.
<!DOCTYPE html>
<html>
<head>
<meta charset="utf-8">
<meta name="viewport" content="initial-scale=1,maximum-scale=1,user-scalable=no">
<title></title>
<style>
html,
body,
#viewDiv {
padding: 0;
margin: 0;
height: 100%;
width: 100%;
}
</style>
<link rel="stylesheet" href="https://js.arcgis.com/4.6/esri/css/main.css">
<script src="https://js.arcgis.com/4.6/"></script>
<script src="script/regiones.js"></script>
<script>
require([
"esri/Map",
"esri/views/SceneView",
"esri/geometry/Polygon",
"esri/symbols/SimpleFillSymbol",
"dojo/dom",
"dojo/domReady!"
], function(Map, SceneView, Polygon, SimpleFillSymbol) {
var map = new Map({
basemap: "osm",
ground: "world-elevation"
});
var view = new SceneView({
container: "viewDiv",
map: map
center: [-71.650,-35.400]
});
var ringsRegiones = [
coordReg["arica"]
];
var polygonRegiones = new Polygon({
rings: ringsRegiones
});
var fillSymbolRegiones = new SimpleFillSymbol({
color: [227, 139, 79, 0.5],
outline: {
color: [0, 255, 197],
width: 2
}
});
var polygonGraphicRegiones = new Graphic({
geometry: polygonRegiones,
symbol: fillSymbolRegiones
});
view.graphics.add(polygonGraphicRegiones);
});
</script>
</head>
<body>
<div id="viewDiv"></div>
</body>
</html>
Solved! Go to Solution.
Accepted Solutions
- Mark as New
- Bookmark
- Subscribe
- Mute
- Subscribe to RSS Feed
- Permalink
- Report Inappropriate Content
Jose,
Your point order in your polygon ring needs to go clockwise, your currently is counter-clockwise with is the issue:
So I just reversed the array and it worked fine (line 45).
<!DOCTYPE html>
<html>
<head>
<meta charset="utf-8">
<meta name="viewport" content="initial-scale=1,maximum-scale=1,user-scalable=no">
<title></title>
<style>
html,
body,
#viewDiv {
padding: 0;
margin: 0;
height: 100%;
width: 100%;
}
</style>
<link rel="stylesheet" href="https://js.arcgis.com/4.6/esri/css/main.css">
<script src="https://js.arcgis.com/4.6/"></script>
<script src="script/regiones.js"></script>
<script>
require([
"esri/Map",
"esri/views/SceneView",
"esri/geometry/Polygon",
"esri/symbols/SimpleFillSymbol",
"esri/Graphic",
"dojo/dom",
"dojo/domReady!"
], function(Map, SceneView, Polygon, SimpleFillSymbol, Graphic) {
var map = new Map({
basemap: "osm",
ground: "world-elevation"
});
var view = new SceneView({
container: "viewDiv",
map: map,
center: [-71.650, -35.400]
});
var ringsRegiones = [
coordReg["arica"].reverse()
];
var polygonRegiones = new Polygon({
rings: ringsRegiones
});
var fillSymbolRegiones = new SimpleFillSymbol({
color: [227, 139, 79, 0.5],
outline: {
color: [0, 255, 197],
width: 2
}
});
var polygonGraphicRegiones = new Graphic({
geometry: polygonRegiones,
symbol: fillSymbolRegiones
});
view.graphics.add(polygonGraphicRegiones);
});
</script>
</head>
<body>
<div id="viewDiv"></div>
</body>
</html>- Mark as New
- Bookmark
- Subscribe
- Mute
- Subscribe to RSS Feed
- Permalink
- Report Inappropriate Content
Jose,
I don’t see anything wrong in your code you posted so that leads be to believe that ther must be something wrong with the geometry of those polygons, unless it is the case where you are querying a map service and have reached the max records for that service.
- Mark as New
- Bookmark
- Subscribe
- Mute
- Subscribe to RSS Feed
- Permalink
- Report Inappropriate Content
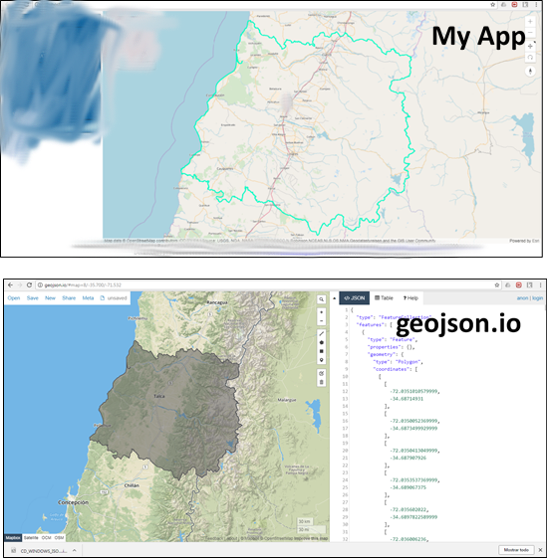
Hi, thanks for your answer, try the polygon points in http://geojson.io and they are drawn well and the color of the interior appears perfect, but in my app only the color of the border appears.
Attached picture with the explained.
- Mark as New
- Bookmark
- Subscribe
- Mute
- Subscribe to RSS Feed
- Permalink
- Report Inappropriate Content
Jose,
Can you provide your regiones.js for testing?
- Mark as New
- Bookmark
- Subscribe
- Mute
- Subscribe to RSS Feed
- Permalink
- Report Inappropriate Content
- Mark as New
- Bookmark
- Subscribe
- Mute
- Subscribe to RSS Feed
- Permalink
- Report Inappropriate Content
Jose,
Your point order in your polygon ring needs to go clockwise, your currently is counter-clockwise with is the issue:
So I just reversed the array and it worked fine (line 45).
<!DOCTYPE html>
<html>
<head>
<meta charset="utf-8">
<meta name="viewport" content="initial-scale=1,maximum-scale=1,user-scalable=no">
<title></title>
<style>
html,
body,
#viewDiv {
padding: 0;
margin: 0;
height: 100%;
width: 100%;
}
</style>
<link rel="stylesheet" href="https://js.arcgis.com/4.6/esri/css/main.css">
<script src="https://js.arcgis.com/4.6/"></script>
<script src="script/regiones.js"></script>
<script>
require([
"esri/Map",
"esri/views/SceneView",
"esri/geometry/Polygon",
"esri/symbols/SimpleFillSymbol",
"esri/Graphic",
"dojo/dom",
"dojo/domReady!"
], function(Map, SceneView, Polygon, SimpleFillSymbol, Graphic) {
var map = new Map({
basemap: "osm",
ground: "world-elevation"
});
var view = new SceneView({
container: "viewDiv",
map: map,
center: [-71.650, -35.400]
});
var ringsRegiones = [
coordReg["arica"].reverse()
];
var polygonRegiones = new Polygon({
rings: ringsRegiones
});
var fillSymbolRegiones = new SimpleFillSymbol({
color: [227, 139, 79, 0.5],
outline: {
color: [0, 255, 197],
width: 2
}
});
var polygonGraphicRegiones = new Graphic({
geometry: polygonRegiones,
symbol: fillSymbolRegiones
});
view.graphics.add(polygonGraphicRegiones);
});
</script>
</head>
<body>
<div id="viewDiv"></div>
</body>
</html>- Mark as New
- Bookmark
- Subscribe
- Mute
- Subscribe to RSS Feed
- Permalink
- Report Inappropriate Content
Thank you very much Robet for your explanation, it works perfect