Turn on suggestions
Auto-suggest helps you quickly narrow down your search results by suggesting possible matches as you type.
Cancel
- Home
- :
- All Communities
- :
- Developers
- :
- JavaScript Maps SDK
- :
- JavaScript Maps SDK Questions
- :
- Problem with graphics on the map
Options
- Subscribe to RSS Feed
- Mark Topic as New
- Mark Topic as Read
- Float this Topic for Current User
- Bookmark
- Subscribe
- Mute
- Printer Friendly Page
Problem with graphics on the map
Subscribe
1587
2
04-06-2010 05:22 AM
04-06-2010
05:22 AM
- Mark as New
- Bookmark
- Subscribe
- Mute
- Subscribe to RSS Feed
- Permalink
- Report Inappropriate Content
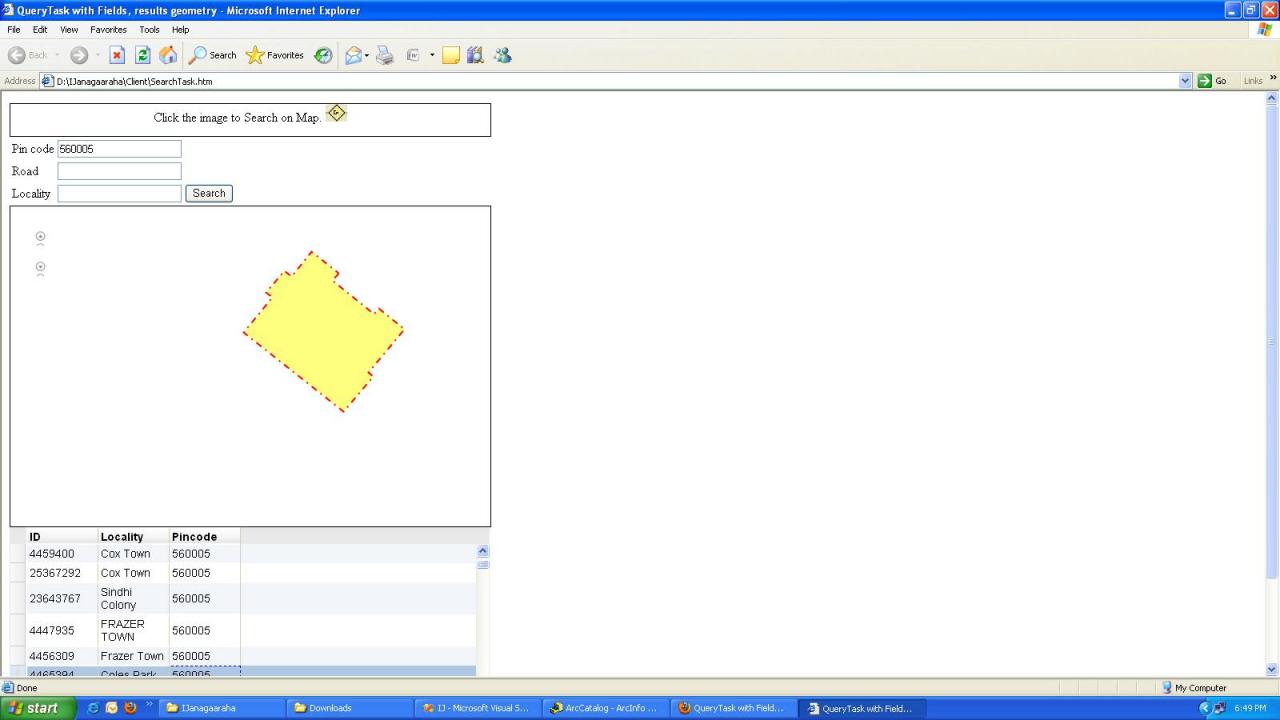
When I have zoom to a graphic on the map by clicking on a grid row, it is zooming perfectly. but when i zoom in or out with mouse wheel only graphics are showing but map is disappearing.
I am attaching the problem screen shots also......
please help me the earliest
I am attaching the problem screen shots also......
please help me the earliest
2 Replies
by
Anonymous User
Not applicable
04-06-2010
01:22 PM
- Mark as New
- Bookmark
- Subscribe
- Mute
- Subscribe to RSS Feed
- Permalink
- Report Inappropriate Content
Original User: Kelly
I tested using a sample from the server blog and can't reproduce the issue, however my test case may be quite different than yours.
Can you provide more details about this issue, for example does it only happen with a particular browser? A code snippet may also help.
Sample Test Application:
http://serverapps.esri.com/javascript_examples/StateZoom.html
04-06-2010
09:10 PM
- Mark as New
- Bookmark
- Subscribe
- Mute
- Subscribe to RSS Feed
- Permalink
- Report Inappropriate Content
here i am giving my code
djConfig={parseOnLoad:true}
dojo.require("esri.map");
dojo.require("esri.tasks.query");
dojo.require("dojox.grid.DataGrid");
dojo.require("dojo.data.ItemFileReadStore");
var map, queryTask, query;
var symbol, infoTemplate;
var features=[];
var grid, store;
function init() {
//esri.config.defaults.io.alwaysUseProxy = true;
dojo.connect(grid, "onRowClick", onRowClickHandler);
//create map
map = new esri.Map("mapDiv");
// map = new esri.Map("mapDiv");
// esri.config.defaults.io.proxyUrl = "http://appd04/server/proxy.ashx";
// esri.config.defaults.io.alwaysUseProxy = true;
//create and add new layer
var layer = new esri.layers.ArcGISDynamicMapServiceLayer("http://appd04/ArcGIS/rest/services/IJ/MapServer");
map.addLayer(layer);
//Listen for click event on the map, when the user clicks on the map call executeQueryTask function.
// dojo.connect(map, "onClick", executeQueryTask);
//build query task
queryTask = new esri.tasks.QueryTask("http://appd04/ArcGIS/rest/services/IJan/MapServer/7");
//Can listen for onComplete event to process results or can use the callback option in the queryTasks.execute method.
//dojo.connect(queryTask, "onComplete", showResults);
//build query filter
query = new esri.tasks.Query();
query.outSpatialReference=new esri.SpatialReference({wkid:4326});
query.returnGeometry = true;
query.outFields = ["OBJECTID","LOCALITY", "PIN"];
//create the infoTemplate to be used in the infoWindow.
//All ${attributeName} will be substituted with the attribute value for current feature.
infoTemplate = new esri.InfoTemplate("${LOCALITY}", "Pin Code: ${PIN}");
symbol = new esri.symbol.SimpleFillSymbol(esri.symbol.SimpleFillSymbol.STYLE_SOLID, new esri.symbol.SimpleLineSymbol(esri.symbol.SimpleLineSymbol.STYLE_DASHDOT, new dojo.Color([255,0,0]), 2), new dojo.Color([255,255,0,0.5]));
}
function executeQueryTask() {
//onClick event returns the evt point where the user clicked on the map.
//This is contains the mapPoint (esri.geometry.point) and the screenPoint (pixel xy where the user clicked).
//set query geometry = to evt.mapPoint Geometry
// query.geometry = evt.mapPoint;
var Locality=null;
var pinCode = null
var road = null;
var query1 = "";
if (document.getElementById('locality').value != "") {
if (query1 != "")
query1 = query1 + " & " + "LOCALITY='" + document.getElementById('locality').value + "'";
else
query1 = "LOCALITY='" + document.getElementById('locality').value + "'";
}
else {
query1 = query1 + "";
}
if (document.getElementById('pin').value != "") {
if(query1!="")
query1 = query1 + " & " + " PIN=" + document.getElementById('pin').value;
else
query1 = "PIN=" + document.getElementById('pin').value;
}
else {
query1 = query1 + "";
}
if (document.getElementById('road').value) {
if (query1 != "")
query1 = query1 + " & " + "BLDGROAD='" + document.getElementById('road').value + " '";
else
query1 = "BLDGROAD='" + document.getElementById('road').value + "'";
}
else {
query1 = query1 + "";
}
//if (document.getElementById('locality').value != "" && document.getElementById('pin').value != "" && document.getElementById('road').value) {
// query.where = "LOCALITY='" + document.getElementById('locality').value + "' && PIN='" + document.getElementById('pin').value + "' && BLDGROAD='" + document.getElementById('road').value + "'";
//}
query.where = query1;
//Execute task and call showResults on completion
queryTask.execute(query, showResults);
}
function showResults(featureSet) {
//remove all graphics on the maps graphics layer
map.graphics.clear();
var items = [];
//QueryTask returns a featureSet. Loop through features in the featureSet and add them to the map.
for (var i=0, il=featureSet.features.length; i<il; i++) {
//Get the current feature from the featureSet.
//Feature is a graphic
items.push(featureSet.features.attributes)
features.push(featureSet.features);
// var graphic = featureSet.features;
// graphic.setSymbol(symbol);
// //Set the infoTemplate.
// graphic.setInfoTemplate(infoTemplate);
//Add graphic to the map graphics layer.
//map.graphics.add(graphic);
//map.setExtent(graphic.geometry.getExtent(),true);
}
var data = {
identifier: "OBJECTID", //This field needs to have unique values
label: "OBJECTID", //Name field for display. Not pertinent to a grid but may be used elsewhere.
items: items
};
//Create data store and bind to grid.
store = new dojo.data.ItemFileReadStore({ data:data });
grid.setStore(store);
grid.setQuery({ OBJECTID: '*' });
}
function onRowClickHandler(evt){
var clickedTaxLotId = grid.getItem(evt.rowIndex).OBJECTID;
var selectedTaxLot;
for (var i=0, il=features.length; i<il; i++) {
var currentGraphic = features;
currentGraphic.setSymbol(symbol);
map.graphics.clear();
map.graphics.add(currentGraphic);
if ((currentGraphic.attributes) && currentGraphic.attributes.OBJECTID == clickedTaxLotId){
selectedTaxLot = currentGraphic;
break;
}
}
var taxLotExtent = selectedTaxLot.geometry.getExtent();
map.setExtent(taxLotExtent);
}
// dojo.addOnLoad(init);
function Hid() {
if (map == null) {
document.getElementById('parm').style.visibility = 'visible';
document.getElementById('mapDiv').style.visibility = 'visible';
dojo.addOnLoad(init);
}
}
for all browsers i am getting same issue.....