- Home
- :
- All Communities
- :
- Developers
- :
- JavaScript Maps SDK
- :
- JavaScript Maps SDK Questions
- :
- Re: How to improve the feature layer renderer perf...
- Subscribe to RSS Feed
- Mark Topic as New
- Mark Topic as Read
- Float this Topic for Current User
- Bookmark
- Subscribe
- Mute
- Printer Friendly Page
How to improve the feature layer renderer performance?
- Mark as New
- Bookmark
- Subscribe
- Mute
- Subscribe to RSS Feed
- Permalink
- Report Inappropriate Content
When large amounts of points (about 40,000) on the map (no clusters allowed), the pan / zoom operator will pending for a long time. Is there any way to improve this?
The constraints include:
1. no cluster allowed
2. using arcgis js api 3.X
3. at least 40,000 points
4. no tiles
<!DOCTYPE html>
<html>
<head>
<meta charset="utf-8">
<meta name="viewport" content="initial-scale=1, maximum-scale=1, user-scalable=no">
<title>Students</title>
<link rel="stylesheet" href="https://js.arcgis.com/3.18/esri/css/esri.css">
</head>
<body>
<div id="map" style="width: 100%; height: 900px;"></div>
<script src="https://js.arcgis.com/3.18/"></script>
<script type="text/javascript">
require(["esri/map", "esri/layers/FeatureLayer", "esri/symbols/SimpleMarkerSymbol", "esri/renderers/SimpleRenderer", "esri/Color"], function(Map,FeatureLayer,SimpleMarkerSymbol,SimpleRenderer,Color){
var map = new Map("map", {
basemap: "streets",
center: [-87.252628,30.639658],
zoom: 10,
logo: false,
showAttribution: false
});
var url = "https://services.arcgis.com/a3bwkdJaVo8mjuX0/arcgis/rest/services/Escambia_Students/FeatureServer/0";
var studentLayer = new FeatureLayer(url,{
id: "student",
mode: FeatureLayer.MODE_SNAPSHOT,
outFields: ["*"]
});
var symbol = new SimpleMarkerSymbol().setColor(new Color("blue")).setSize(6);
var renderer = new SimpleRenderer(symbol);
studentLayer.setRenderer(renderer);
map.addLayers([studentLayer]);
});
</script>
</body>
</html>- Mark as New
- Bookmark
- Subscribe
- Mute
- Subscribe to RSS Feed
- Permalink
- Report Inappropriate Content
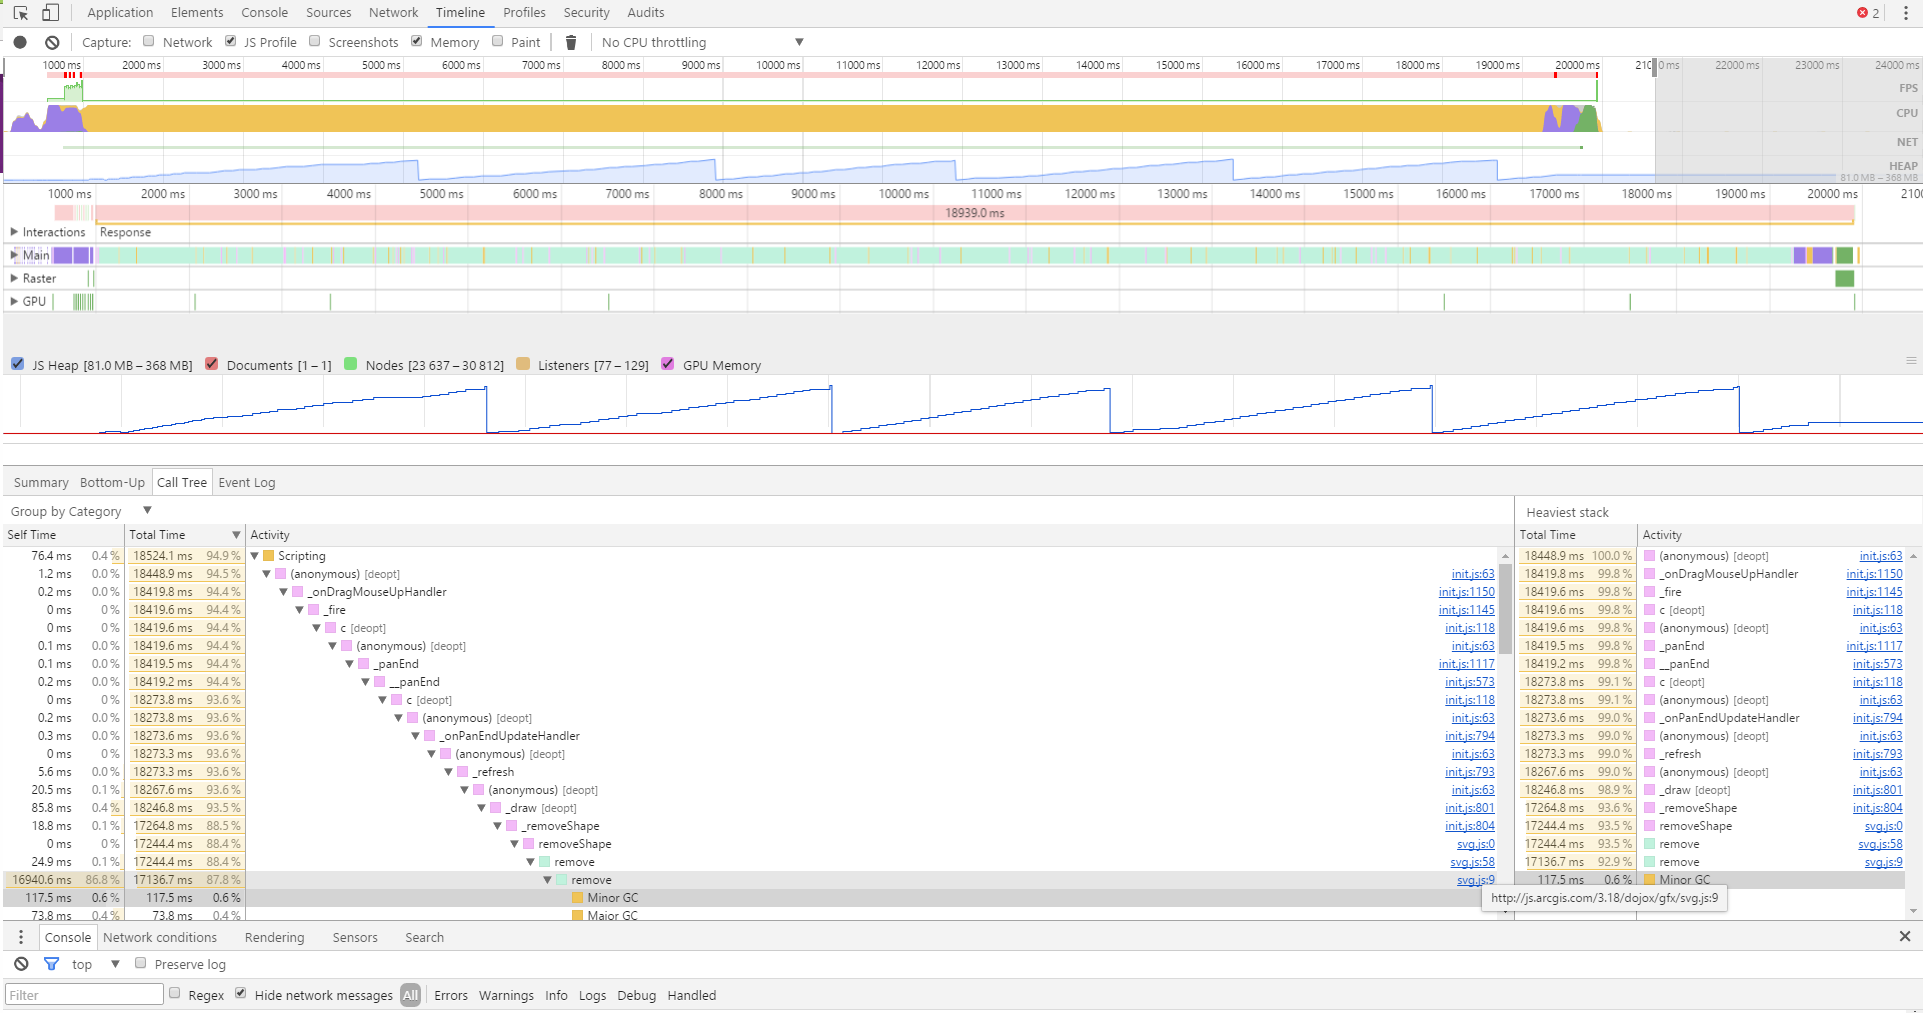
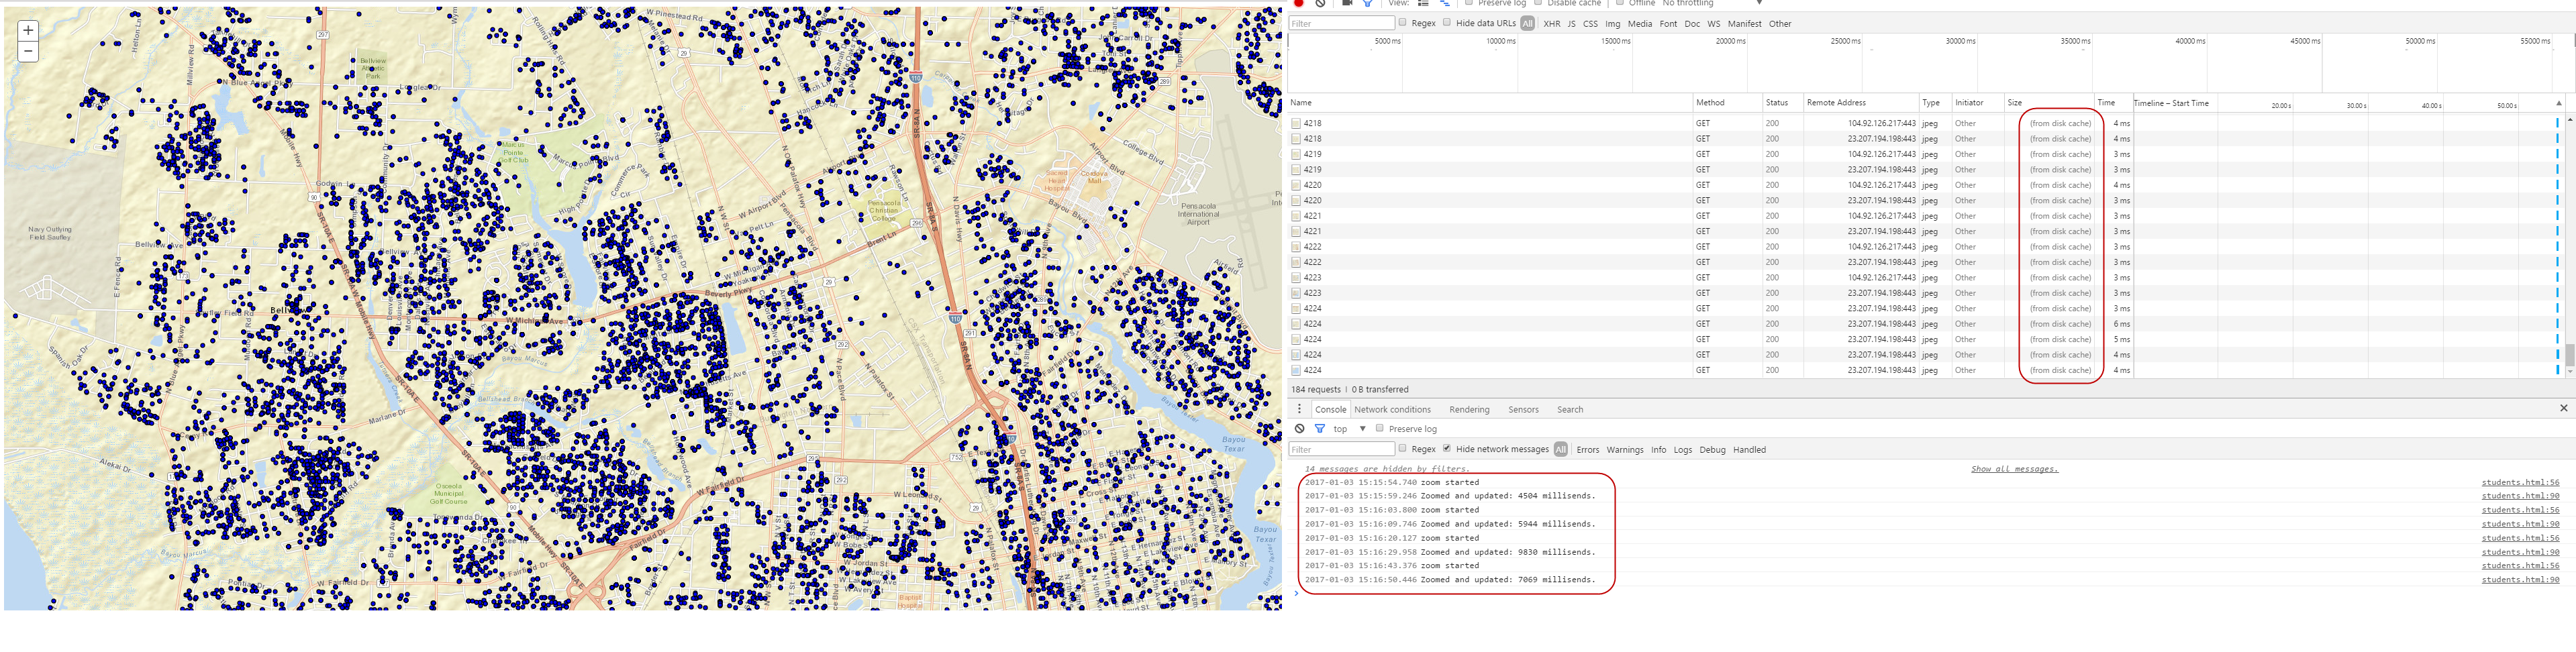
I try to calculate the time and enable cache for basemap. I notice that the results of the graphic is drawn by <svg>. Then I remove the excess svg attributes.
The result shows that it takes about 6-7 seconds on average for each zoom operator.
Do you have more suggestions? Thanks.
<!DOCTYPE html>
<html>
<head>
<meta charset="utf-8">
<meta name="viewport" content="initial-scale=1, maximum-scale=1, user-scalable=no">
<title>Students</title>
<link rel="stylesheet" href="https://js.arcgis.com/3.18/esri/css/esri.css">
</head>
<body>
<div id="map" style="width: 100%; height: 900px;"></div>
<script src="https://js.arcgis.com/3.18/"></script>
<script type="text/javascript">
require(["esri/map", "esri/layers/FeatureLayer", "esri/symbols/SimpleMarkerSymbol", "esri/renderers/SimpleRenderer", "esri/Color"], function(Map,FeatureLayer,SimpleMarkerSymbol,SimpleRenderer,Color){
var map = new Map("map", {
basemap: "streets",
center: [-87.252628,30.639658],
zoom: 10,
logo: false,
showAttribution: false
});
var url = "https://services.arcgis.com/a3bwkdJaVo8mjuX0/arcgis/rest/services/Escambia_Students/FeatureServer/0";
var studentLayer = new FeatureLayer(url,{
id: "student",
mode: FeatureLayer.MODE_SNAPSHOT,
outFields: ["*"]
});
var symbol = new SimpleMarkerSymbol().setColor(new Color("blue")).setSize(6);
var renderer = new SimpleRenderer(symbol);
studentLayer.setRenderer(renderer);
studentLayer.on("graphic-draw", graphicDrawHandler);
map.addLayers([studentLayer]);
var panStart = map.on("pan-start", panHandler);
var panStartTime;
var zoomStart = map.on("zoom-start", zoomHandler);
var zoomStartTime;
var updateStart = map.on("update-start", updateStartHandler);
var updateStartTime;
var updateEnd = map.on("update-end", updateEndHandler);
var currentAction = "none";
function panHandler(event){
console.log("pan started");
panStartTime = performance.now();
currentAction = "pan";
};
function zoomHandler(event){
console.log("zoom started");
zoomStartTime = performance.now();
currentAction = "zoom";
};
function updateStartHandler(event){
if(currentAction == "none"){
console.log("update started");
updateStartTime = performance.now();
currentAction = "update";
}
};
function updateEndHandler(event){
switch(currentAction){
case "pan":
calculateElapsedTime(panStartTime, performance.now(), "Panned and updated");
break;
case "zoom":
calculateElapsedTime(zoomStartTime, performance.now(), "Zoomed and updated");
break;
case "update":
calculateElapsedTime(updateStartTime, performance.now(), "Updated");
break;
default:
console.log("default");
break;
}
currentAction = "none";
};
function calculateElapsedTime(start, end, label){
var diff = end-start;
diff = diff<10?Number(diff.toFixed(1)):Number(diff.toFixed(0));
console.log(label + ": "+ diff + " millisends.");
};
function graphicDrawHandler(event){
event.node.removeAttribute("stroke-opacity");
event.node.removeAttribute("stroke-linecap");
event.node.removeAttribute("stroke-linejoin");
event.node.removeAttribute("stroke-miterlimit");
event.node.removeAttribute("stroke-dasharray");
event.node.removeAttribute("transform");
event.node.removeAttribute("dojoGfxStrokeStyle");
};
});
</script>
</body>
</html>- Mark as New
- Bookmark
- Subscribe
- Mute
- Subscribe to RSS Feed
- Permalink
- Report Inappropriate Content
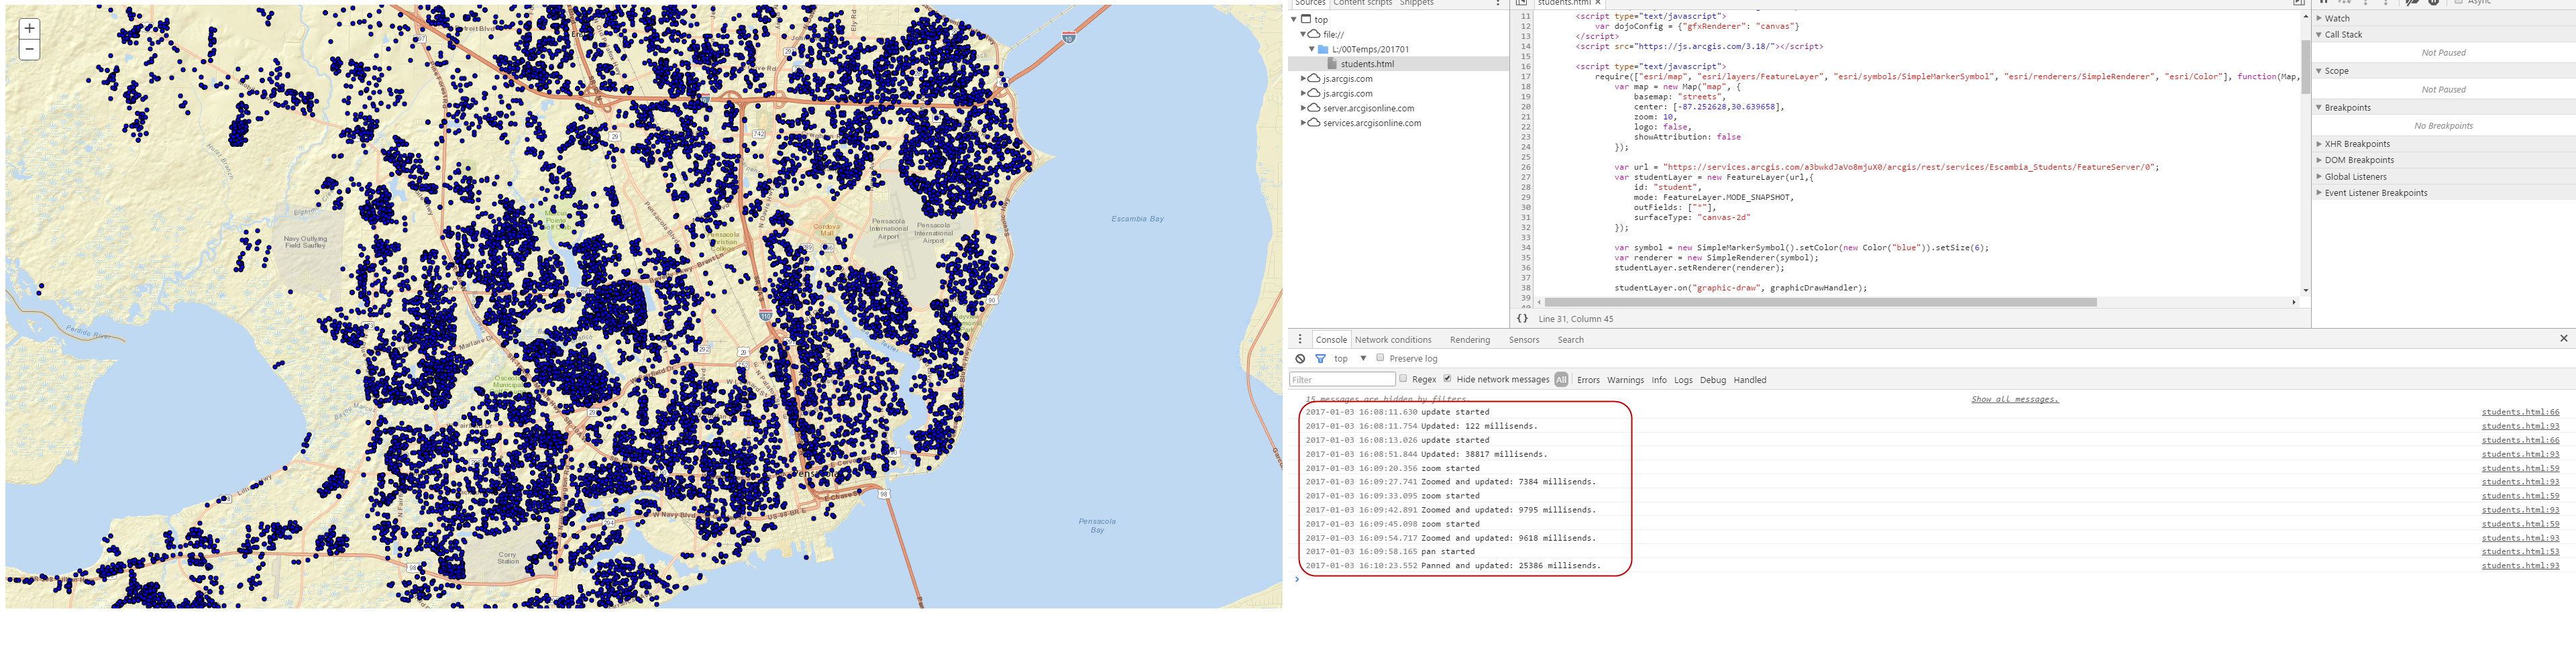
I've tried canvas instead of svg. But the result seems slower than svg.
- enable chrome cache for basemap
- Mark as New
- Bookmark
- Subscribe
- Mute
- Subscribe to RSS Feed
- Permalink
- Report Inappropriate Content
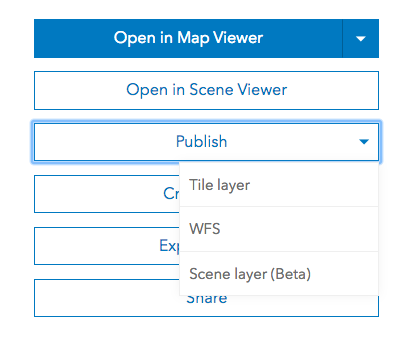
One thing you can do is publish it as a tile layer on ArcGIS Online. This will improve the performance and give you all the same FeatureLayer capabilities.
On a side note, why is it required to display all points without any form of aggregation?
- Mark as New
- Bookmark
- Subscribe
- Mute
- Subscribe to RSS Feed
- Permalink
- Report Inappropriate Content
Kristian,
Thank you for your reply!
I know the tile layer (raster/vector) is an option for the problem. However, in my case, the tiles is not allowed (due to the server and real time synchronous, moreover, the students will be updated [geometry / attributes] on the database ).
And now I focus on the dojo svg performance, is there any other suggestions?
- Mark as New
- Bookmark
- Subscribe
- Mute
- Subscribe to RSS Feed
- Permalink
- Report Inappropriate Content
An alternative may be to minimize the data shown on different scales by setting a definition query in order to show only a part of the data just for navigation purposes. On a next scale and when the data will be less than a number you may count (query by extent the count for this layer, FeatureLayer | API Reference | ArcGIS API for JavaScript 3.19 ) you will allow draw full information.
Of course the scale dependency is an option but as I can understand is not desirable solution.
- Mark as New
- Bookmark
- Subscribe
- Mute
- Subscribe to RSS Feed
- Permalink
- Report Inappropriate Content
Panagiotis,
Thank you for your suggestion!
Your suggestion is an option to display large amounts of points on the map. I agree with you on this side.
However, on the other side, as the amount of data (graphics) decreased, the original problem is changed. Maybe there are lots of way to decreased the number of graphics drawing on the map (cluster, definition query [spatial or attribute query], zoom-based symbolization...). However, that's not my goal on this issue.
On the user side, they only want to see all the location (point geometry) and the map rendering fluently.
I wonder how to using arcgis api for javascript display more than 30,000 vector points on a map with fluently pan and zoom.
Besides, I found an example which using the leaflet for R (Shiny - SuperZip example ). But I'm not familiar with leaflet. I'm trying to use the esri leaflet (Esri Leaflet). I think the current result is better than esri js api. I'm still looking for a better solution using esri javascript API first.
Here is the script using esri leaflet:
<!DOCTYPE html>
<html>
<head>
<meta charset="utf-8">
<meta name="viewport" content="initial-scale=1, maximum-scale=1, user-scalable=no">
<title>EsriLeaflet</title>
<link rel="stylesheet" href="https://unpkg.com/leaflet@1.0.1/dist/leaflet.css" />
<script src="https://unpkg.com/leaflet@1.0.1/dist/leaflet-src.js"></script>
</head>
<body>
<div id="map" style="width: 100%; height: 900px;"></div>
<script src="https://unpkg.com/esri-leaflet@2.0.6"></script>
<script type="text/javascript">
var map = L.map("map").setView([30.639658, -87.252628], 10);
L.esri.basemapLayer("Streets").addTo(map);
var studentsUrl = "https://services.arcgis.com/a3bwkdJaVo8mjuX0/arcgis/rest/services/Escambia_Students/FeatureServer/0";
L.esri.query({
url: studentsUrl
}).where("OBJECTID <= 30000").run(function(error, students){
var student = L.geoJSON(students, {
style: function(){
return {color: "#0000FF"}
},
pointToLayer: function(feature, latlng){
return new L.CircleMarker(latlng, { radius: 4,
fillColor: "#0000FF",
color: "#000000",
weight: 1,
opacity: 1})
}
}).addTo(map);
map.fitBounds(student.getBounds());
});
</script>
</body>
</html>- Mark as New
- Bookmark
- Subscribe
- Mute
- Subscribe to RSS Feed
- Permalink
- Report Inappropriate Content
Leo-
Why are you using snapshot mode on your feature layer? Do you have to have all points visible at all times regardless of extent? Do all points have to be visible when panning?
We get good results with 1000's of points when using On Demand mode, by disabling draw on pan, and controlling visibility scale. That plus projecting our data in web mercator. I also notice you are using a hosted feature layer, so keep in mind that the hosted service is going to return a max of 1000 records per request, I don't think you can change that.
David
- Mark as New
- Bookmark
- Subscribe
- Mute
- Subscribe to RSS Feed
- Permalink
- Report Inappropriate Content
Hi, David
The max result record count can be set by esri online (How To: Update the maximum record count for feature services in ArcGIS Online). The default value is 1000.

Next, the MODE_ONDEMAND option is not my expectation. As the result shows, it will send lots of requests each time, that is not what we want.

Besides, under the MODE_ONDEMAND, the graphics showing piece by piece, not very comfortalbe.
And the graphics count is above 30,000, 1000 is too small on my situation.
Thanks!
Leo
- Mark as New
- Bookmark
- Subscribe
- Mute
- Subscribe to RSS Feed
- Permalink
- Report Inappropriate Content
Sure. I don't think what you want is possible, at least with a 3.x feature layer. 4.x is more efficient at rendering feature layer graphics, but you'd be better off looking into the other soluctions already mentioned.