- Home
- :
- All Communities
- :
- Developers
- :
- JavaScript Maps SDK
- :
- JavaScript Maps SDK Questions
- :
- How to fix this javascript to join two scripts to ...
- Subscribe to RSS Feed
- Mark Topic as New
- Mark Topic as Read
- Float this Topic for Current User
- Bookmark
- Subscribe
- Mute
- Printer Friendly Page
How to fix this javascript to join two scripts to get the desired output?
- Mark as New
- Bookmark
- Subscribe
- Mute
- Subscribe to RSS Feed
- Permalink
- Report Inappropriate Content
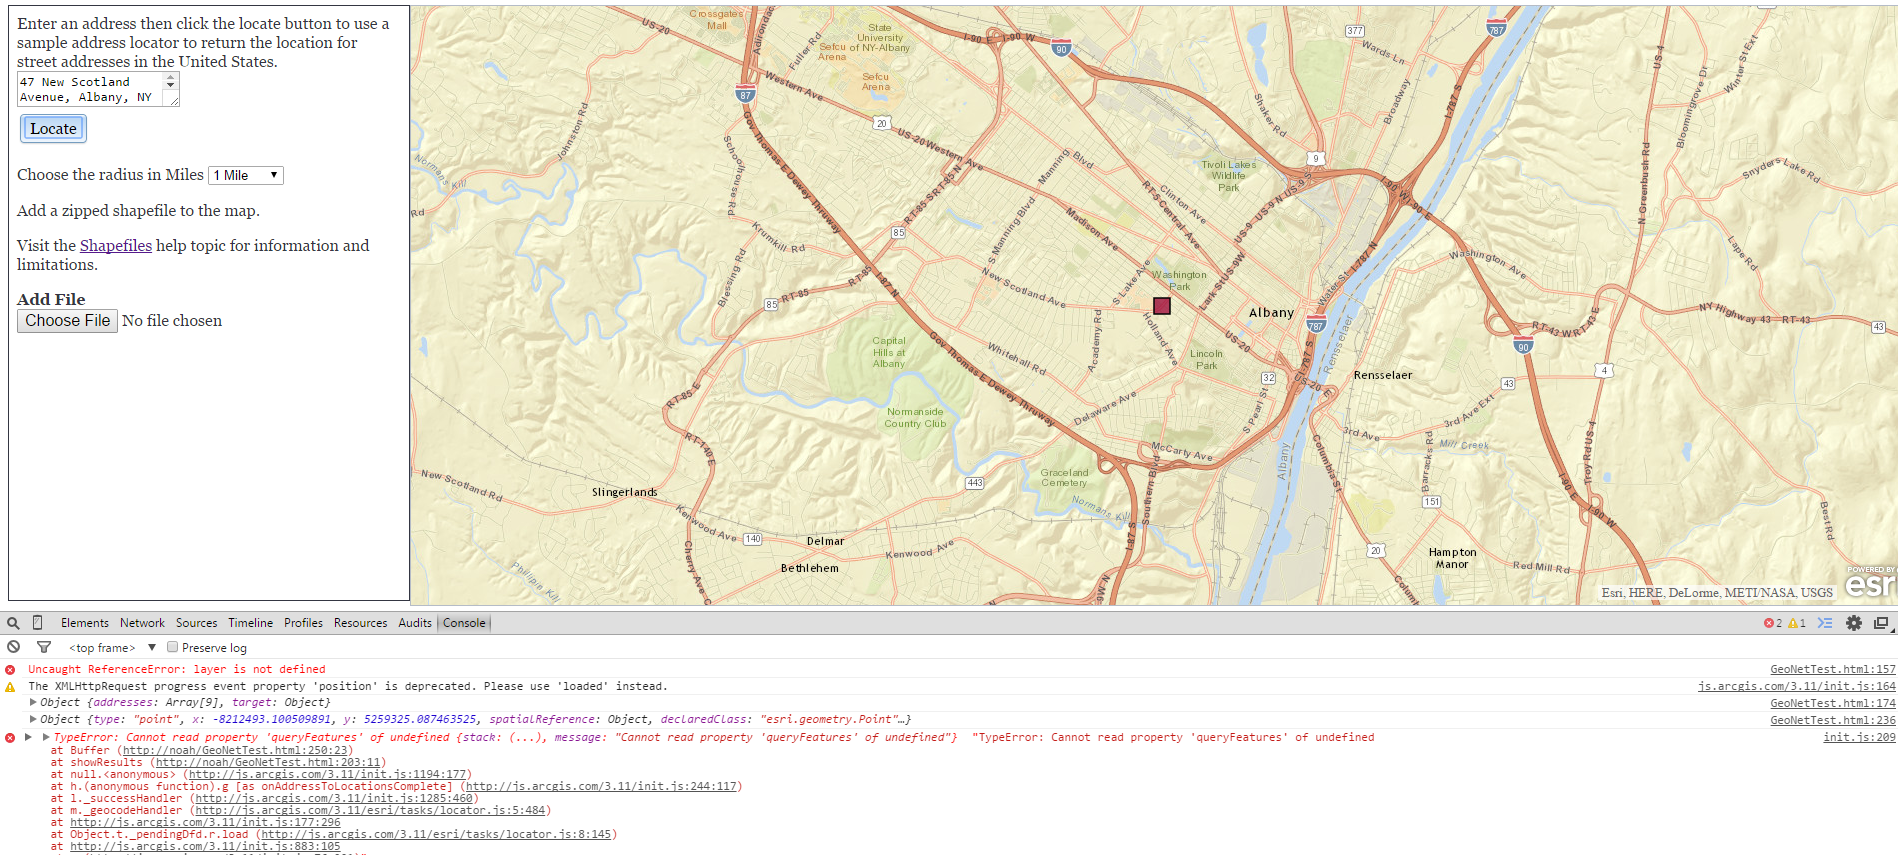
I wrote this script and used some online help but it's not working. This script should geocode the address and then draw a circle (radius specified)around the address and then upload the zip shapefile and pull the data within the circle. this script is able to geocode the address but put the symbol on the address but its not doing anything else. I am not sure what's wrong in this script. Attached is the screen shot of what I got so far.
<!DOCTYPE html>
<html>
<head>
<meta http-equiv="Content-Type" content="text/html; charset=utf-8">
<!--The viewport meta tag is used to improve the presentation and behavior of the samples
on iOS devices-->
<meta name="viewport" content="initial-scale=1, maximum-scale=1,user-scalable=no">
<title>Select with feature layer</title>
<link rel="stylesheet" href="http://js.arcgis.com/3.11/dijit/themes/claro/claro.css">
<link rel="stylesheet" href="http://js.arcgis.com/3.11/esri/css/esri.css">
<style>
html, body, #mapDiv {
padding: 0;
margin: 0;
height: 100%;
}
#leftPanel{
width:20%;
border-top: solid 1px #343642;
border-left: solid 1px #343642;
border-bottom: solid 1px #343642;
border-right: solid 1px #343642;
margin:0px 0px 5px 5px;
color: #343642;
font:100% Georgia,"Times New Roman",Times,serif;
/*letter-spacing: 0.05em;*/
}
</style>
<script src="http://js.arcgis.com/3.11/"></script>
<script>
var map, candidateLocation;
require([
"esri/map", "esri/request", "esri/geometry/scaleUtils", "esri/layers/FeatureLayer", "esri/tasks/locator",
"esri/tasks/query", "esri/geometry/Circle",
"esri/graphic", "esri/InfoTemplate", "esri/symbols/SimpleMarkerSymbol",
"esri/symbols/SimpleLineSymbol", "esri/symbols/SimpleFillSymbol", "esri/renderers/SimpleRenderer",
"esri/symbols/Font", "esri/symbols/TextSymbol",
"dojo/_base/array", "dijit/registry",
"esri/config", "esri/Color", "dojo/dom", "dojo/parser", "dojo/json", "dojo/_base/lang", "dijit/layout/BorderContainer", "dijit/layout/ContentPane",
"dijit/form/Button", "dijit/form/Textarea", "dojo/on",
"dojo/domReady!"
], function(
Map, request, scaleUtils, FeatureLayer, Locator,
Query, Circle,
Graphic, InfoTemplate, SimpleMarkerSymbol,
SimpleLineSymbol, SimpleFillSymbol, SimpleRenderer,
Font, TextSymbol,
arrayUtils, registry,
esriConfig, Color, dom, parser, JSON, lang, on
) {
parser.parse();
// use a proxy page if a URL generated by this page is greater than 2000 characters
//
// this should not be needed as nearly all query & select functions are performed on the client
esriConfig.defaults.io.proxyUrl = "/proxy/";
on(dom.byId("uploadForm"), "change", function (event) {
var fileName = event.target.value.toLowerCase();
if (sniff("ie")) { //filename is full path in IE so extract the file name
var arr = fileName.split("\\");
fileName = arr[arr.length - 1];
}
if (fileName.indexOf(".zip") !== -1) {//is file a zip - if not notify user
generateFeatureCollection(fileName);
}
else {
dom.byId('upload-status').innerHTML = '<p style="color:red">Add shapefile as .zip file</p>';
}
});
map = new Map("mapDiv", {
basemap: "streets",
center: [-95.249, 38.954],
zoom: 14,
slider: false
});
function generateFeatureCollection (fileName) {
var name = fileName.split(".");
//Chrome and IE add c:\fakepath to the value - we need to remove it
//See this link for more info: http://davidwalsh.name/fakepath
name = name[0].replace("c:\\fakepath\\", "");
dom.byId('upload-status').innerHTML = '<b>Loading </b>' + name;
//Define the input params for generate see the rest doc for details
//http://www.arcgis.com/apidocs/rest/index.html?generate.html
var params = {
'name': name,
'targetSR': map.spatialReference,
'maxRecordCount': 1000,
'enforceInputFileSizeLimit': true,
'enforceOutputJsonSizeLimit': true
};
//generalize features for display Here we generalize at 1:40,000 which is approx 10 meters
//This should work well when using web mercator.
var extent = scaleUtils.getExtentForScale(map, 40000);
var resolution = extent.getWidth() / map.width;
params.generalize = true;
params.maxAllowableOffset = resolution;
params.reducePrecision = true;
params.numberOfDigitsAfterDecimal = 0;
var myContent = {
'filetype': 'shapefile',
'publishParameters': JSON.stringify(params),
'f': 'json',
'callback.html': 'textarea'
};
request({
url: portalUrl + '/sharing/rest/content/features/generate',
content: myContent,
form: dom.byId('uploadForm'),
handleAs: 'json',
load: lang.hitch(this, function (response) {
if (response.error) {
errorHandler(response.error);
return;
}
var layerName = response.featureCollection.layers[0].layerDefinition.name;
dom.byId('upload-status').innerHTML = '<b>Loaded: </b>' + layerName;
addShapefileToMap(response.featureCollection);
}),
error: lang.hitch(this, errorHandler)
});
}
function errorHandler (error) {
dom.byId('upload-status').innerHTML =
"<p style='color:red'>" + error.message + "</p>";
}
function addShapefileToMap (featureCollection) {
var fullExtent;
var layers = [];
arrayUtils.forEach(featureCollection.layers, function (layer) {
var infoTemplate = new InfoTemplate("CellTower", "${*}");
var featureLayer = new FeatureLayer(layer, {
infoTemplate: infoTemplate
});
//associate the feature with the popup on click to enable highlight and zoom to
featureLayer.on('click', function (event) {
map.infoWindow.setFeatures([event.graphic]);
});
//change default symbol if desired. Comment this out and the layer will draw with the default symbology
changeRenderer(featureLayer);
fullExtent = fullExtent ?
fullExtent.union(featureLayer.fullExtent) : featureLayer.fullExtent;
layers.push(featureLayer);
});
map.addLayers(layers);
map.setExtent(fullExtent.expand(1.25), true);
dom.byId('upload-status').innerHTML = "";
}
locator = new Locator("http://geocode.arcgis.com/arcgis/rest/services/World/GeocodeServer");
locator.on("address-to-locations-complete", showResults);
registry.byId("locate").on("click", locate);
var featureLayer = new FeatureLayer(layer,{
            infoTemplate: infoTemplate,
            outFields: ["SOURCE_CAS","SOURCE_SIT","SOURCE_OEM", "SOURCE_MAR", "SOURCE_LEA", "SOURCE_TOT"]
        });
function locate() {
map.graphics.clear();
var address = {
"SingleLine": dom.byId("address").value
};
locator.outSpatialReference = map.spatialReference;
var options = {
address: address,
outFields: ["Loc_name"]
};
locator.addressToLocations(options);
}
function showResults(evt) {
console.log(evt);
var symbol = new SimpleMarkerSymbol();
var infoTemplate = new InfoTemplate(
"Location",
"Address: ${address}<br />Score: ${score}<br />Source locator: ${locatorName}"
);
symbol.setStyle(SimpleMarkerSymbol.STYLE_SQUARE);
symbol.setColor(new Color([153,0,51,0.75]));
var geom;
arrayUtils.every(evt.addresses, function(candidate) {
if (candidate.score > 80) {
candidateLocation = candidate.location;
var attributes = {
address: candidate.address,
score: candidate.score,
locatorName: candidate.attributes.Loc_name
};
geom = candidate.location;
var graphic = new Graphic(geom, symbol, attributes, infoTemplate);
//add a graphic to the map at the geocoded location
map.graphics.add(graphic);
map.graphics.add(new Graphic(geom));
return false; //break out of loop after one candidate with score greater than 80 is found.
}
});
if ( geom !== undefined ) {
map.centerAndZoom(geom, 13);
}
Buffer(candidateLocation);
}
// selection symbol used to draw the selected cell tower points within the buffer polygon
var symbol = new SimpleMarkerSymbol(
SimpleMarkerSymbol.STYLE_CIRCLE,
12,
new SimpleLineSymbol(
SimpleLineSymbol.STYLE_NULL,
new Color([247, 34, 101, 0.9]),
1
),
new Color([207, 34, 171, 0.9])
);
featureLayer.setSelectionSymbol(symbol);
//make unselected features invisible
var nullSymbol = new SimpleMarkerSymbol().setSize(0);
featureLayer.setRenderer(new SimpleRenderer(nullSymbol));
map.addLayer(featureLayer);
var circleSymb = new SimpleFillSymbol(
SimpleFillSymbol.STYLE_NULL,
new SimpleLineSymbol(
SimpleLineSymbol.STYLE_SOLID,
new Color([105, 105, 105]),
2
), new Color([255, 255, 0, 0.25])
);
var circle;
//when the address point is there it create a buffer around the address point of the specified distance.
function Buffer(evt){
var radius = dom.byId("Radius").options[dom.byId("Radius").selectedIndex].value;
console.log(evt);
circle = new Circle({
center: evt,
geodesic: true,
radius: radius,
radiusUnit: "esriMiles"
});
map.infoWindow.hide();
var graphic = new Graphic(circle, circleSymb);
map.graphics.add(graphic);
var query = new Query();
query.geometry = circle.getExtent();
//use a fast bounding box query. will only go to the server if bounding box is outside of the visible map
featureLayer.queryFeatures(query, selectInBuffer);
}
function selectInBuffer(response){
var feature;
var features = response.features;
var inBuffer = [];
//filter out features that are not actually in buffer, since we got all points in the buffer's bounding box
for (var i = 0; i < features.length; i++) {
feature = features;
if(circle.contains(feature.geometry)){
inBuffer.push(feature.attributes[featureLayer.objectIdField]);
}
}
var query = new Query();
query.objectIds = inBuffer;
//use a fast objectIds selection query (should not need to go to the server)
featureLayer.selectFeatures(query, FeatureLayer.SELECTION_NEW);
}
});
</script>
</head>
<body class="claro">
<div id="mainWindow" data-dojo-type="dijit/layout/BorderContainer"
data-dojo-props="design:'sidebar', gutters:false"
style="width:100%; height:100%;">
<div id="leftPanel"
data-dojo-type="dijit/layout/ContentPane"
data-dojo-props="region:'left'">
Enter an address then click the locate button to use a sample address locator to return the location for
street addresses in the United States.
<br>
<textarea id="address">47 New Scotland Avenue, Albany, NY 12208</textArea>
<br>
<button id="locate" data-dojo-type="dijit/form/Button">Locate</button>
<br>
<br>
Choose the radius in Miles
<select id="Radius">
<option selected="selected" value="1">1 Mile</option>
<option value="5">5 Miles</option>
<option value="10">10 Miles</option>
</select>
<br>
<p>
Add a zipped shapefile to the map.</p><p>Visit the
<a target='_blank' href="http://doc.arcgis.com/en/arcgis-online/reference/shapefiles.htm">Shapefiles</a> help topic for information and limitations.</p>
<form enctype="multipart/form-data" method="post" id="uploadForm">
<div class="field">
<label class="file-upload">
<span><strong>Add File</strong></span>
<input type="file" name="file" id="inFile" />
</label>
</div>
</form>
<span class="file-upload-status" style="opacity:1;" id="upload-status"></span>
<div id="fileInfo"> </div>
</div>
<div id="mapDiv" data-dojo-type="dijit/layout/ContentPane" data-dojo-props="region:'center'">
</div>
</div>
</body>
</html>
- Mark as New
- Bookmark
- Subscribe
- Mute
- Subscribe to RSS Feed
- Permalink
- Report Inappropriate Content
Your require modules aren't matching up with your function arguments. "dojo/on" has to be placed before "dijit/layout/BorderContainer", which is why this line doesn't run.
on(dom.byId("uploadForm"), "change", function (event) {
- Mark as New
- Bookmark
- Subscribe
- Mute
- Subscribe to RSS Feed
- Permalink
- Report Inappropriate Content
- Mark as New
- Bookmark
- Subscribe
- Mute
- Subscribe to RSS Feed
- Permalink
- Report Inappropriate Content
Running the above code in Chrome (after fixing the require statement) with the Developer Tools open, yields this error:
Uncaught ReferenceError: layer is not defined (GeoNetTest.html:157).
Looks like this line of code is causing you trouble, as layer is not a valid FeatureLayer (at around line 157).
var featureLayer = new FeatureLayer(layer,{
infoTemplate: infoTemplate,
outFields: ["SOURCE_CAS","SOURCE_SIT","SOURCE_OEM", "SOURCE_MAR", "SOURCE_LEA", "SOURCE_TOT"]
});Hope this helps. Happy Holidays.
Regards,
Noah
Screenshot:
- Mark as New
- Bookmark
- Subscribe
- Mute
- Subscribe to RSS Feed
- Permalink
- Report Inappropriate Content
Hi Noah,
I am not sure how to define this layer as this layer is the shapefile which I am trying to upload. Whe choose the file it just shows loading Zipfile but doesn't pull the data in the map,
This script should do the following function:
- user needs to enter the address and specify the radius and click locate
- it should geocode the address and put the marker on the address
- draw a circle on the specified radius.
- user should specified the Zipfile (shapefile) path
- then it should load the data and shows the data which falls under that radius.
now in this script it's only geocoding the address but other than that nothing is working. I am new to javascript so don't know much about it.
Thanks for help.
- Mark as New
- Bookmark
- Subscribe
- Mute
- Subscribe to RSS Feed
- Permalink
- Report Inappropriate Content
Hmm, I do not think that you can add a shapefile to the map as a feature layer. I have seen a JavaScript sample where you can add a shapefile to the map as a feature collection though:
Also, here is a link to documentation about working with shapefiles in a web application:
Shapefiles—ArcGIS Online Help | ArcGIS
Hope this helps.
Regards,
Noah
- Mark as New
- Bookmark
- Subscribe
- Mute
- Subscribe to RSS Feed
- Permalink
- Report Inappropriate Content
Instead of featureLayer.queryFeatures, has you tried featureLayer.queryExtent?
(Just a side note: Circle != Buffer)