- Home
- :
- All Communities
- :
- Developers
- :
- JavaScript Maps SDK
- :
- JavaScript Maps SDK Questions
- :
- Finding the angle of a drawn line and snap a symbo...
- Subscribe to RSS Feed
- Mark Topic as New
- Mark Topic as Read
- Float this Topic for Current User
- Bookmark
- Subscribe
- Mute
- Printer Friendly Page
Finding the angle of a drawn line and snap a symbol with it
- Mark as New
- Bookmark
- Subscribe
- Mute
- Subscribe to RSS Feed
- Permalink
- Report Inappropriate Content
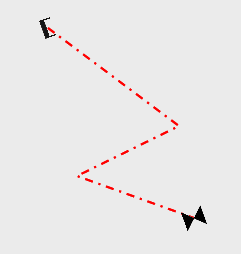
I am drawing a polyline on a map, and adding it to a graphics layer, I would like to snap a PictureMarkerSymbol at the edge of the polyline according to the angle of the line drawn. The picture below is an idea of the solution I want.
Currently I am getting the angle of the first line draw, but the angle is not correctly aligned with the polyline. Is there a way of getting the angle of the line on which I am snapping the symbol in order to rotate that symbol to that angle,
I would really appreciate any help or advice given; since I am a beginner in arcGIS JavaScript and I am really stuck with this problem.
- Mark as New
- Bookmark
- Subscribe
- Mute
- Subscribe to RSS Feed
- Permalink
- Report Inappropriate Content
If these were Linear Reference routes and you could created point events at the ends of the lines or along that line that can automatically generate an angle field for each point event at its position along the line using an Advanced option in the Make Route Event Layer set up. Then you could make the point events a marker symbol. You could place standard point features at the locations where you want the symbols and convert them to point events using the Locate Features Along Routes tool.
If the graphics are always at the end points of the line you can use the Field Calculator and a Python calculation to extract the end point measures of the Route themselves into two fields with these calculations:
!Shape.FirstPoint.M!
!Shape.LastPoint.M!
Then you could export the route fields from its open table view to create an event table with the RouteID and the two measures. The table could be made into two point layers by using the Make Route Event Layer operation twice, with one point layer based on the measure at the From end of the line and the other based on the measure of the To end of the line. The two layers could be symbolized differently with marker symbols and rotated according to the angle field that would be generated when you made the point event layers. You could convert those point event features to graphics if you wanted.
With the second approach you could draw every line you wanted, do the calculation at the end, export the table, create the two layers and convert to graphics for as many lines as you want without having to repeat the steps for one line at a time.
- Mark as New
- Bookmark
- Subscribe
- Mute
- Subscribe to RSS Feed
- Permalink
- Report Inappropriate Content
Thanks for the reply.
I would like to implement this through JavaScript API
Thanks again.