- Home
- :
- All Communities
- :
- Developers
- :
- JavaScript Maps SDK
- :
- JavaScript Maps SDK Questions
- :
- Re: Showing a number on a circle
- Subscribe to RSS Feed
- Mark Topic as New
- Mark Topic as Read
- Float this Topic for Current User
- Bookmark
- Subscribe
- Mute
- Printer Friendly Page
Showing a number on a circle
- Mark as New
- Bookmark
- Subscribe
- Mute
- Subscribe to RSS Feed
- Permalink
- Report Inappropriate Content
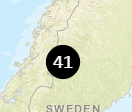
I'm wanting to show a circle with a number on it that represents the number of items that exist at that point. The best I've come up with is to first add a SimpleMarkerSymbol (the circle) followed by a TextSymbol (the text) at the same coordinates. Is this the right approach or is there some other way to go about doing this? Here is what it looks like plus the code and a JS Bin link.
<script>
require([
"esri/Map",
"esri/views/MapView",
"esri/symbols/TextSymbol",
"esri/symbols/SimpleMarkerSymbol",
"esri/Graphic",
"esri/geometry/Point",
"dojo/domReady!"
], function(Map, MapView, TextSymbol, SimpleMarkerSymbol, Graphic, Point) {
var map = new Map({
basemap: "streets"
});
var view = new MapView({
container: "viewDiv",
map: map,
zoom: 4,
center: [15, 65]
});
view.then(function() {
var symbol = new TextSymbol({
text: "41",
font: {
size: 14,
family: "monospace"
},
color: "white",
verticalAlignment: "middle"
});
var textGraphic = new Graphic({
symbol: symbol,
geometry: view.extent.center
});
var circle = new SimpleMarkerSymbol({
color: "black",
size: 25
});
var circleGraphic = new Graphic({
symbol: circle,
geometry: view.extent.center
});
view.graphics.add(circleGraphic);
view.graphics.add(textGraphic);
});
});
</script>Thanks,
Alan
- Mark as New
- Bookmark
- Subscribe
- Mute
- Subscribe to RSS Feed
- Permalink
- Report Inappropriate Content
Alan,
Esri on their GitHub site have a js cluster code (https://github.com/Esri/cluster-layer-js) you could use. As you zoom in & out of the map the number in the circle changes based on the number of points near that site.
Also,
Other people have done things similar eg. https://github.com/nickcam/FlareClusterLayer
Hope this helps
- Mark as New
- Bookmark
- Subscribe
- Mute
- Subscribe to RSS Feed
- Permalink
- Report Inappropriate Content
Hi Anthony,
In my case I'm querying an external data source and need to plot the points manually, e.g. in the image where it shows the number 41, I am getting back a single number rather than 41 individual items that would each be added to the map. I'm unsure by looking at these examples you've provided if they would work in my scenario, I'm guessing they are relying on the layer containing the data itself. Can you let me know?
Thanks,
Alan
- Mark as New
- Bookmark
- Subscribe
- Mute
- Subscribe to RSS Feed
- Permalink
- Report Inappropriate Content
Alan,
It is. We have used this to summate point data relative close to each other (eg. inspection data from Survey123).
- Mark as New
- Bookmark
- Subscribe
- Mute
- Subscribe to RSS Feed
- Permalink
- Report Inappropriate Content
I think the way you did it is perfectly acceptable. We have done many similar things (overlaying multiple symbols, text, alter colors, ect). The only other way I could think of to do what you want is with a Lable and use the Lable offset to position it directly over the current point.
- Mark as New
- Bookmark
- Subscribe
- Mute
- Subscribe to RSS Feed
- Permalink
- Report Inappropriate Content
Thanks for the suggestion - are you referring to the LabelClass? If so, the documentation unfortunately says there is no support for labeling in 2D.
- Mark as New
- Bookmark
- Subscribe
- Mute
- Subscribe to RSS Feed
- Permalink
- Report Inappropriate Content
I was, and Really? Arrg. This 3.x to 4x has been painful.
- Mark as New
- Bookmark
- Subscribe
- Mute
- Subscribe to RSS Feed
- Permalink
- Report Inappropriate Content
No worries, I'll go with the approach I took in the example, thanks for confirming it's acceptable.
- Mark as New
- Bookmark
- Subscribe
- Mute
- Subscribe to RSS Feed
- Permalink
- Report Inappropriate Content
Another option would be to create an SVG image with the number in it, translate it from utf8 to base64, and use it as the url for a PictureMarkerSymbol. Something like:
JS Bin - Collaborative JavaScript Debugging
This example won't rotate with the map, though. I don't see anything wrong with the way you did it.
- Mark as New
- Bookmark
- Subscribe
- Mute
- Subscribe to RSS Feed
- Permalink
- Report Inappropriate Content
Interesting approach, I'll keep that in mind. Thanks for confirming my approach.