- Home
- :
- All Communities
- :
- Developers
- :
- JavaScript Maps SDK
- :
- JavaScript Maps SDK Questions
- :
- Phantom, Persistent, Duplicate Graphics in Graphic...
- Subscribe to RSS Feed
- Mark Topic as New
- Mark Topic as Read
- Float this Topic for Current User
- Bookmark
- Subscribe
- Mute
- Printer Friendly Page
Phantom, Persistent, Duplicate Graphics in GraphicsLayer
- Mark as New
- Bookmark
- Subscribe
- Mute
- Subscribe to RSS Feed
- Permalink
- Report Inappropriate Content
Greetings,
This is definitely strange. I am selecting features from a point, a polyline and a polygon featurelayer by distance from a point. I'm creating a graphics layer for each featuretype and highlighting the graphics in the map. All feature types but the points display properly. The points however, maintain a set of phantom graphics that persist at the zoomscale at which they were created. So when you zoom in, there appear to be a second set of point graphics with the same geometry relationship but at the scale at which the graphics layer was first drawn.
The interesting this is that if I add the graphics to the graphicsLayer and do not refresh programmatically, then when the graphics layer redraws when the zoom scale is changed there is no issue. However, if I redraw the graphics layer programmatically then the issue presents.
I've dug in a little to try to debug this situation. I created a mouseover event on the graphics in the graphicsLayer but the phantom graphics do not respond. The length of the graphics in the graphics layer does not include the phantom graphics either.
Has anyone ever seen this? Also, what method does a zoom change call on the graphicsLayer? I had assumed that redraw was called on the graphicsLayer but redraw also causes the issue to present.
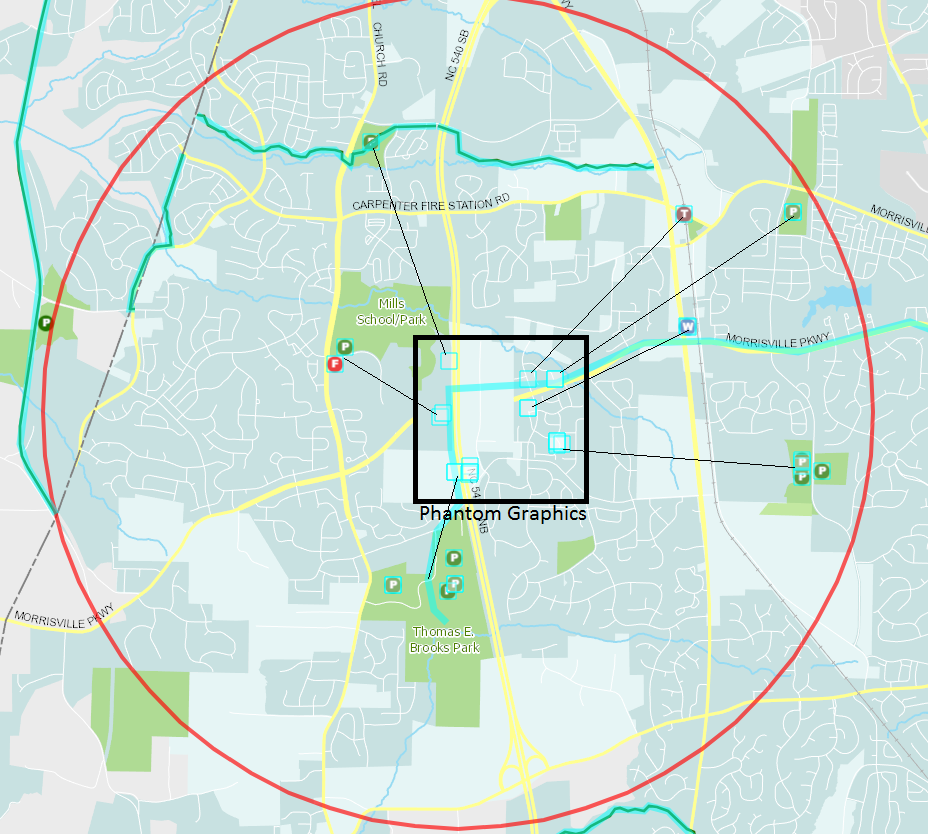
Please see the image that I have included. The 'Phantom Graphics' are outlined in black. I have zoomed in and drawn black lines to the points that these phantom graphics correspond with at the initial scale that graphics layer was drawn at.
Any information or tips will be greatly appreciated.
Tyler
Solved! Go to Solution.
Accepted Solutions
- Mark as New
- Bookmark
- Subscribe
- Mute
- Subscribe to RSS Feed
- Permalink
- Report Inappropriate Content
Thanks for the sample. I spent a while looking at this because it wasn't clear to me how it differed from the sample I made.
What I finally came up with was that removing the outFields: ['*'] from the feature layer constructor fixes this problem in your sample and adding outFields: ['*'] causes the problem to appear in my sample.
I'm not sure why this is the case. It may be because the features returned by queryFeatures have their layer set to the existing feature layer and the layer is trying to optimize at some level and use the queried graphics in the feature layer.
One way around this is to make a new graphic from each result in the queryFeatures call:
featureLayer.queryFeatures(query, featureSet => {
let features = featureSet.features;
if (features.length > 0) {
let graphicsLyr = map.getLayer("pointCIP_GL");
features.forEach(f => {
// create new graphic from feature geometry
// we don't need a symbol, the renderer on the graphics layer
// will take care of that
let g = new Graphic(f.geometry);
graphicsLyr.add(g);
});
}
});- Mark as New
- Bookmark
- Subscribe
- Mute
- Subscribe to RSS Feed
- Permalink
- Report Inappropriate Content
I've run into a similar issue that may or may not be related (in my case I didn't notice any relation to zoom scale). I was creating a graphics layer, adding graphics to it, clearing it, and adding more graphics all within a very small timespan. The result was that some graphics would get "stuck" nondeterministically (from my perspective anyway) i.e. they'd be visible in the view but were nowhere to be found in any graphics collection, and calling graphicsLayer.clear() did nothing.
I fixed this by ensuring that the graphics were not cleared and added within the same fraction of a second (about 100 ms).
The thing to do is probably to try to reproduce this in a sandbox:
1. You're using the 4.4 API, correct? Map View or Scene View?
2. What method are you using to search for nearest graphics?
3. What method are you using to highlight graphics?
4. The graphics layer in question holds the highlights, correct?
Any sample code or pseudocode would also be helpful to replicate this.
- Mark as New
- Bookmark
- Subscribe
- Mute
- Subscribe to RSS Feed
- Permalink
- Report Inappropriate Content
Hi Thomas, Thanks for your comments. This application is in 3.21 I am using a plain ol' featureLayer.queryFeatures() query using a distance and geometry(point) option. I am applying a SimpleRenderer to the GraphicsLayer using a SimpleMarkerSymbol.
Here's the generalized breakdown of the code I am using for this operation.
First, I create a circle graphic and add it to a GraphicsLayer:
circle = new Circle({
center: mapGlobals.bufferPoint
, geodesic: true
, radius: distMiles
, radiusUnit: "esriMiles"
});
var graphic = new Graphic(circle, bufferSymbol);
var bufferGraphicsLayer = map.getLayer("bufferGraphicsLayer");
bufferGraphicsLayer.clear();
bufferGraphicsLayer.add(graphic);
Next, I create a query on my feature layer:
var query = new Query();
query.returnGeometry = true;
query.outFields = ["*"];
query.geometry = mapGlobals.bufferPoint;
query.distance = distMiles;
query.units = "miles";
Next, I create or clear my point line or polygon graphicsLayers:
if (!map.getLayer("pointCIP_GL")) {
renderer = new SimpleRenderer(markerSymbol);
graphicsLayerId = "pointCIP_GL";
var point_GL = new GraphicsLayer();
point_GL.id = graphicsLayerId;
point_GL.renderer = renderer;
map.addLayer(point_GL);
}
else {
map.getLayer("pointCIP_GL").clear();
}
if (!map.getLayer("polylineCIP_GL")) {
renderer = new SimpleRenderer(lineSymbol);
graphicsLayerId = "polylineCIP_GL";
var polyline_GL = new GraphicsLayer();
polyline_GL.id = graphicsLayerId;
polyline_GL.renderer = renderer;
map.addLayer(polyline_GL);
}
else {
map.getLayer("polylineCIP_GL").clear();
}
if (!map.getLayer("polygonCIP_GL")) {
renderer = new SimpleRenderer(fillSymbol);
graphicsLayerId = "polygonCIP_GL";
var polygon_GL = new GraphicsLayer();
polygon_GL.id = graphicsLayerId;
polygon_GL.renderer = renderer;
map.addLayer(polygon_GL);
}
else {
map.getLayer("polygonCIP_GL").clear();
}
I then query each of the featureLayers in a Theme JSON object (CIPTheme):
for (i in CIPTheme.layers) {
var layer = CIPTheme.layers;
console.log(JSON.stringify(layer.id))
var featureLayer = map.getLayer(layer.id);
outerLayerCount++;
featureLayer.queryFeatures(query, function (featureSet) {
var feature;
var features = featureSet.features;
var featureType;
var graphicsLayerId;
var renderer;
var infoTemplate;
innerLayerCount++;
if (features.length > 0) {
featureType = features[0].geometry.type
switch (featureType) {
case "point":
map.getLayer("pointCIP_GL").graphics = features;
//if I don't call .redraw() method on these layers the graphicsLayer does not draw in until
//the map zooms but the 'phantom graphics' do not show up. However if I call redraw here the
//graphicsLayer draws initially but after zoom change the 'phantom graphics' show up.
// point_GL.redraw();
break;
case "polyline":
polyline_GL.graphics = features;
// polyline_GL.redraw();
break;
case "polygon":
map.getLayer("polygonCIP_GL").graphics = features;
// polygon_GL.redraw();
break;
}
}
From here I go on to create custom JSON objects from the graphics attributes for use in visualizations outside the map.
Please let me know if I may provide additional details or snipits.
Thanks, Tyler
- Mark as New
- Bookmark
- Subscribe
- Mute
- Subscribe to RSS Feed
- Permalink
- Report Inappropriate Content
Thanks for the information, I'll try to reproduce this later today.
- Mark as New
- Bookmark
- Subscribe
- Mute
- Subscribe to RSS Feed
- Permalink
- Report Inappropriate Content
That is awesome of you! Thanks, Tyler
- Mark as New
- Bookmark
- Subscribe
- Mute
- Subscribe to RSS Feed
- Permalink
- Report Inappropriate Content
Here's my attempt to reproduce: JS Bin - Collaborative JavaScript Debugging - click map to perform a search. Everything seems to be working normally. I'm only doing this for a single point feature service though.
I would try calling graphicsLayer.add() for each graphic in the returned featureSet rather than setting the .graphics property equal to featureSet.features. I couldn't get the "highlight" graphics to show up at all, even with a redraw, using the method you posted.
- Mark as New
- Bookmark
- Subscribe
- Mute
- Subscribe to RSS Feed
- Permalink
- Report Inappropriate Content
Thanks for the suggestion. I tried the features.forEach() method and the problem still persists. Let me know if you have any other thoughts or suggestions and I'll give them a try. Thanks again.
- Mark as New
- Bookmark
- Subscribe
- Mute
- Subscribe to RSS Feed
- Permalink
- Report Inappropriate Content
Thomas Solow, I created a HTML/ESRI JavaScript API 3.21 that I created for ESRI support. I thought I'd share it here too. To reproduce the 'phantom graphic' issue follow these steps:
1. Preview the attached html file.
2. Click on the map near some trees to reverse geocode a point.
3. Click on the 'Buffer & Find nearby trees' button in the resultant popup window to create a graphics layer that shows the selection set of trees within 0.1 miles of your click point.
4. With the light blue selection set added to the map as a graphics layer, zoom in one step and the 'phantom-graphics' will appear.
- Mark as New
- Bookmark
- Subscribe
- Mute
- Subscribe to RSS Feed
- Permalink
- Report Inappropriate Content
Thanks for the sample. I spent a while looking at this because it wasn't clear to me how it differed from the sample I made.
What I finally came up with was that removing the outFields: ['*'] from the feature layer constructor fixes this problem in your sample and adding outFields: ['*'] causes the problem to appear in my sample.
I'm not sure why this is the case. It may be because the features returned by queryFeatures have their layer set to the existing feature layer and the layer is trying to optimize at some level and use the queried graphics in the feature layer.
One way around this is to make a new graphic from each result in the queryFeatures call:
featureLayer.queryFeatures(query, featureSet => {
let features = featureSet.features;
if (features.length > 0) {
let graphicsLyr = map.getLayer("pointCIP_GL");
features.forEach(f => {
// create new graphic from feature geometry
// we don't need a symbol, the renderer on the graphics layer
// will take care of that
let g = new Graphic(f.geometry);
graphicsLyr.add(g);
});
}
});- Mark as New
- Bookmark
- Subscribe
- Mute
- Subscribe to RSS Feed
- Permalink
- Report Inappropriate Content
Hi Thomas Solow,
I wasn't able to get this exact example to work in my production environment. However, ended up getting something similar to your example to work.
for(var i =0; i < features.length ; i++){
var g = new Graphic(features.geometry, markerSymbol);
graphicsLyr.add(g) ;
}
Thanks for all of your help on this.
Tyler