- Home
- :
- All Communities
- :
- Developers
- :
- JavaScript Maps SDK
- :
- JavaScript Maps SDK Questions
- :
- Re: JSON (from Feature Layer Query) to html table
- Subscribe to RSS Feed
- Mark Topic as New
- Mark Topic as Read
- Float this Topic for Current User
- Bookmark
- Subscribe
- Mute
- Printer Friendly Page
JSON (from Feature Layer Query) to html table
- Mark as New
- Bookmark
- Subscribe
- Mute
- Subscribe to RSS Feed
- Permalink
- Report Inappropriate Content
I'm trying to make a table directly from a JSON produced by a feature layer query.
I want to do the same that you can watch in this tutorial: JSON data to HTML Table using Ajax Jquery getJSON method - YouTube
I try to use too some diferents plugins in wordpress, but no one work. I don't now why. Maybe is because this JSON format is not usual.
Any help will be appreciated
Solved! Go to Solution.
Accepted Solutions
- Mark as New
- Bookmark
- Subscribe
- Mute
- Subscribe to RSS Feed
- Permalink
- Report Inappropriate Content
David,
It is just that the JSON structure is more complex then what they were demoing in that video. This work fine:
<!DOCTYPE html>
<html>
<head>
<title> Json to table using Ajax Jquery getJSON</title>
<script src="http://code.jquery.com/jquery-latest.js"></script>
<script src="https://ajax.googleapis.com/ajax/libs/jquery/3.1.0/jquery.min.js"></script>
<link rel="stylesheet" href="https://maxcdn.bootstrapcdn.com/bootstrap/3.3.6/css/bootstrap.min.css" />
<script src="https://maxcdn.bootstrapcdn.com/bootstrap/3.3.7/js/bootstrap.min.js"></script>
</head>
<body>
<div class="container">
<div class="table-responsive">
<h1> Proyectos Axial</h1>
<br />
<table class="table table-bordered table-striped" id="proyecto_table">
<tr>
<th>Proyecto</th>
<th>País</th>
<th>Tipo</th>
<th>Año</th>
<th>Mw</th>
<th>Servicio</th>
</tr>
</table>
</div>
</div>
</body>
</html>
<script>
$(document).ready(function() {
$.getJSON(
`https://services3.arcgis.com/jnX4wFvqGblynr5O/ArcGIS/rest/services/201801_Proyectos_Axial_P/FeatureS....`,
function(data) {
var proyecto_data = '';
console.info(data.features);
$.each(data.features, function(key, value) {
proyecto_data += '<tr>';
proyecto_data += '<td>' + value.attributes.Proyecto + '</td>';
proyecto_data += '<td>' + value.attributes.Pais + '</td>';
proyecto_data += '<td>' + value.attributes.Tipo + '</td>';
proyecto_data += '<td>' + value.attributes.Ano + '</td>';
proyecto_data += '<td>' + value.attributes.Mw + '</td>';
proyecto_data += '<td>' + value.attributes.Servicio + '</td>';
proyecto_data += '<tr>';
});
$('#proyecto_table').append(proyecto_data);
});
});
</script>
- Mark as New
- Bookmark
- Subscribe
- Mute
- Subscribe to RSS Feed
- Permalink
- Report Inappropriate Content
Great!! Thank you very much!!
- Mark as New
- Bookmark
- Subscribe
- Mute
- Subscribe to RSS Feed
- Permalink
- Report Inappropriate Content
Thanks, this is great... Can you advise how I would go about loading a json from a windows auth arcgis server rest service?
If I use the above configuration with the rest endpoint for a windows auth service I get a "401 (unauthorized)"
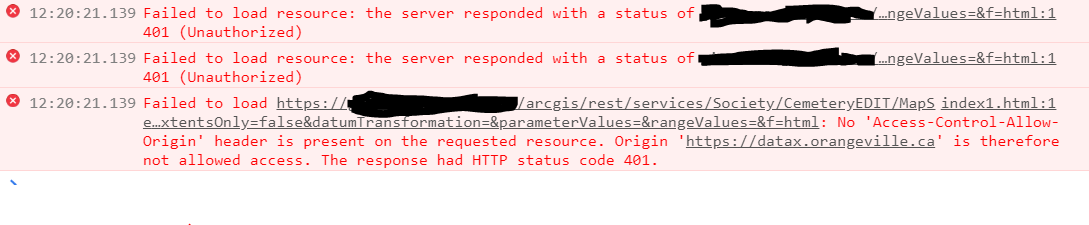
Cheers
- Mark as New
- Bookmark
- Subscribe
- Mute
- Subscribe to RSS Feed
- Permalink
- Report Inappropriate Content
Evan,
I have never worked with a windows auth secured service before but I would guess you need to pass a token in the url or something.
- Mark as New
- Bookmark
- Subscribe
- Mute
- Subscribe to RSS Feed
- Permalink
- Report Inappropriate Content
You can also use the jQuery DataTables plugin to produce an interactive HTML table; this includes options for scrolling, pagination, download buttons, and much more. If the service is secured, you would need to get an OAuth Token first and then append the token to your URL query.
This is a commented template that I use for building tables from ArcGIS REST services, based on a URL to a JSON generated by the Query tool at the REST endpoint - this will work provided the the Max Record query limit is less than the total number of records. You can modify the query limit at the Admin REST endpoint for the service.
To begin, a references to jQuery DataTables and default CSS styles for DataTables will need to be added to the page header. If using the Buttons extension to enable download of table data, additional JS and CSS references will need to be included. The following shows the full header for a page with download options enabled:
<!-- Have to do this to support Internet Explorer -->
<meta http-equiv="X-UA-Compatible" content="IE=edge">
<!-- Must include references to jQuery 1.10 and jQuery datatables -->
<script type="text/javascript" src="http://www.maine.gov/awt/js5/jquery-1.10.2.min.js"></script>
<script type="text/javascript" language="javascript" src="http://cdn.datatables.net/1.10.7/js/jquery.dataTables.min.js"></script>
<!-- Include these references if using export buttons -->
<script type="text/javascript" language="javascript" src="https://cdn.datatables.net/buttons/1.5.2/js/dataTables.buttons.min.js"></script>
<script type="text/javascript" language="javascript" src="https://cdn.datatables.net/buttons/1.5.2/js/buttons.flash.min.js"></script>
<script type="text/javascript" language="javascript" src="https://cdnjs.cloudflare.com/ajax/libs/jszip/3.1.3/jszip.min.js"></script>
<script type="text/javascript" language="javascript" src="https://cdnjs.cloudflare.com/ajax/libs/pdfmake/0.1.36/pdfmake.min.js"></script>
<script type="text/javascript" language="javascript" src="https://cdnjs.cloudflare.com/ajax/libs/pdfmake/0.1.36/vfs_fonts.js"></script>
<script type="text/javascript" language="javascript" src="https://cdn.datatables.net/buttons/1.5.2/js/buttons.html5.min.js"></script>
<script type="text/javascript" language="javascript" src="https://cdn.datatables.net/buttons/1.5.2/js/buttons.print.min.js"></script>
<!-- Prebuilt CSS styles for data tables -->
<link rel="stylesheet" type="text/css" href="https://cdn.datatables.net/1.10.19/css/jquery.dataTables.css">
<!-- CSS styles for export buttons -->
<link rel="stylesheet" type="text/css" href="https://cdn.datatables.net/buttons/1.5.2/css/buttons.dataTables.min.css">Moving on to set up the style table in HTML - add a heading for the table and CSS styling. In the example I use default DataTables styling but then add custom CSS to center align text in the table. Note this would center align ANY table in the page.
<!-- Heading for above the table -->
<h3 id="landings_list_h">List of lobster landings per year.</h3>
<!-- Include this style tag if adding search fields to the footer of the table -->
<style type="text/css" class="init">
tfoot input {
width: 100%;
font-size: 8pt;
padding: 1px;
box-sizing: border-box;
}
</style>
<!-- Optionally set custom CSS for table here. This CSS center aligns all columns
in all tables. For help see here: https://www.w3schools.com/css/css_table.asp -->
<style type="text/css" class="custom_table">
table {
border-collapse: collapse;
}
th {
text-align: center;
}
td {
text-align: center;
}
</style>Then set up the actual table, assigning the table a unique ID and adding column headers for the data. The column names can be different from the name of the source field connecting to the table - the data from AGOL will be inserted by index, not by name. The table style was setup using the options available from DataTables, as explained here.
<!-- Set table ID here and build HTML table. Use DataTables CSS options from https://datatables.net/manual/styling/classes
or use class = "custom_table" if only using CSS defined in custom CSS above -->
<table id="landings_table" class= "stripe cell-border order-column hover" cellspacing="0" width="100%">
<thead>
<tr>
<!-- Add the column header names for the table here -->
<th width=10>Year</th>
<th width=10>Port</th>
<th width=10>Pounds Landed</th>
<th width=10>Value Landed</th>
</tr>
</thead>
<!-- Include tfoot tag if using search fields at bottom of table, and put field names in. -->
<tfoot>
<tr>
<th>Year</th>
<th>Port</th>
<th>Pounds Landed</th>
<th>Value Landed</th>
</tr>
</tfoot>
<tbody>
</tbody>
</table>The HTML for the table is setup - now we need some JavaScript to insert the data from the query to AGOL into the table. The template below should be modified in the following ways:
- The table ID from above should be inserted anywhere in the below example where
#landings_tableis found. - The URL from the REST endpoint should be inserted after the URL variable - make sure it is in quotes and has a semi-colon at the end.
- The attributes fields, in the order of how they should appear in the table, must be specified.
- Numerous options can be toggled for the table appearance, such as scrolling, pagination, download options, etc; each of these options is commented in the included template code and below.
<!-- JavaScript to populate table starts here --> <script type='text/javascript'> $(document).ready(function() { // Setup - add a text input to each footer cell. Omit this if no search fields needed. $('#landings_table tfoot th').each( function () { // Change table element ID here var title = $('#landings_table thead th').eq( $(this).index() ).text(); // Change table element ID here $(this).html( '<input type="text" placeholder="Search '+title+'" />' ); } ); // Put in URL to AGOL JSON, build using ArcGIS REST endpoint query tool (query 1=1, fields = *) var url = "https://services1.arcgis.com/RbMX0mRVOFNTdLzd/arcgis/rest/services/MaineDMR_Lobster_Landings/FeatureServer/0/query?where=1%3D1&objectIds=&time=&resultType=none&outFields=*&returnHiddenFields=false&returnIdsOnly=false&returnUniqueIdsOnly=false&returnCountOnly=false&returnDistinctValues=false&orderByFields=&groupByFieldsForStatistics=&outStatistics=&having=&resultOffset=&resultRecordCount=&sqlFormat=none&f=pjson"; // DataTable settings - for more help see here: https://datatables.net/reference/option/ var table = $('#landings_table').DataTable({ // Change table element ID here dom: 'Bfrtip', // Add this to enable export buttons buttons: [ // Add this to choose which buttons to display 'copy', 'csv', 'excel', 'pdf', 'print' ], "autoWidth": false, // Feature control DataTables' smart column width handling "deferRender": true, // Feature control deferred rendering for additional speed of initialisation. "info": true, // Display info about table including filtering "lengthChange": false, // If pagination is enabled, allow the page length to be changed by user "ordering": true, // Toggle user ordering of table columns "paging": false, // Toggle table paging "processing": true, // Toggle "processing" indicator useful when loading large table/filter "scrollX": false, // Left/right scrolling option, in pixels or false to disable "scrollY": "400px", // Table height in pixels before up/down scrolling, or false to disable scrolling "searching": true, // Toggle search all columns field "stateSave": false, // If true, table will restore to user filtered state when page is reopened "scrollCollapse": true, // If true, the table will be collapsed if the height of the records is < the scrollY option; prevents footer from floating "ajax": { // Load data from AJAX data source (JSON) "url": url, // JSON URL "dataSrc": "features" // Within the JSON, the source for the data. For AGOL tables this will be "features" }, "columns": [ // Location within the JSON of each column to pipe into the HTML table, in order of columns. For AGOL items, fields stored within attributes array of JSON. { data: "attributes.Year" }, { data: "attributes.PORT_2"}, { data: "attributes.TOTAL_POUNDS", render: $.fn.dataTable.render.number( ',', '.', 0)}, // Use render to format with commas, see here: https://datatables.net/manual/data/renderers#Number-helper { data: "attributes.TOTAL_VALUE", render: $.fn.dataTable.render.number( ',', '.', 2, '$' )} // Use render to format as $ ], "language": { "emptyTable": "Loading...", "search": "Search all fields:" } }); // Apply the search, if using search fields for each column; remove if not using. table.columns().every( function () { var that = this; $( 'input', this.footer() ).on( 'keyup change', function () { that .search( this.value ) .draw(); }); }); // Remove up to here if not using field searches }); </script> </body> </html>
- Mark as New
- Bookmark
- Subscribe
- Mute
- Subscribe to RSS Feed
- Permalink
- Report Inappropriate Content
William, this is a great example. I'm currently struggling with getting DataTables to alter the AJAX request for sorting when my REST endpoint expects "orderByFields = <FIELD><ASC/DESC>", and DataTables just sends the two "order" params defined at https://datatables.net/manual/server-side
If I could somehow self-reference those options in the "data" function, I could customize the request and make it work. But your example makes me think you got it working WITHOUT customization. Maybe that's because you're not using the serverSide option and have less than the typical Esri REST-endpoint limit of 1,000 rows. Could you confirm that's true? Thanks --mike
- Mark as New
- Bookmark
- Subscribe
- Mute
- Subscribe to RSS Feed
- Permalink
- Report Inappropriate Content
I usually set the order in the REST query - typically I navigate to the service endpoint and use the graphical query builder to generate a URL. In the above example (service is now offline), there is no ordering, the data is already ordered appropriately.
You could also specify client-side ordering, or as per the link you provided it seems possible to pass the ordering specified by the table to the URL. To append the ordering to the URL, it seems like you would need to concatenate the values provided by the link you gave into the URL for the field and field order.
- Mark as New
- Bookmark
- Subscribe
- Mute
- Subscribe to RSS Feed
- Permalink
- Report Inappropriate Content
Yeah, I originally specified the ordering in the REST query but didn't like having to then mess with the native styles. Sorry I edited my original before seeing your response...if I do client-side, I am limited to the 1,000 features returned by the server. So yes, I'm trying to do that concatenation you mention, but I don't know how to "snoop" on the order requested by the user when creating that concatenation. I'm searching for examples of where the DataTables request can be self-referenced.
- Mark as New
- Bookmark
- Subscribe
- Mute
- Subscribe to RSS Feed
- Permalink
- Report Inappropriate Content
I figured it out! Pretty much already had it in my code - referencing the request itself is pretty easy inside the "data" function. In this way, the original sort order can be set, AND the user can then sort themselves, but it still works with server-side functioning and more than 1,000 rows (which I had previously taken care of by the dataSrc function).
I already had the first two lines, just added the d.orderByFields line: