- Home
- :
- All Communities
- :
- Developers
- :
- JavaScript Maps SDK
- :
- JavaScript Maps SDK Questions
- :
- Re: How to render an ImageryLayer with a RasterStr...
- Subscribe to RSS Feed
- Mark Topic as New
- Mark Topic as Read
- Float this Topic for Current User
- Bookmark
- Subscribe
- Mute
- Printer Friendly Page
How to render an ImageryLayer with a RasterStretchRenderer
- Mark as New
- Bookmark
- Subscribe
- Mute
- Subscribe to RSS Feed
- Permalink
- Report Inappropriate Content
I'm trying to render an ImageryLayer by assigning it a Renderer to stylize it. I'm using a RasterStretchRenderer but it is not behaving as I would expect. Here is a CodePen sample of what I've got set up.
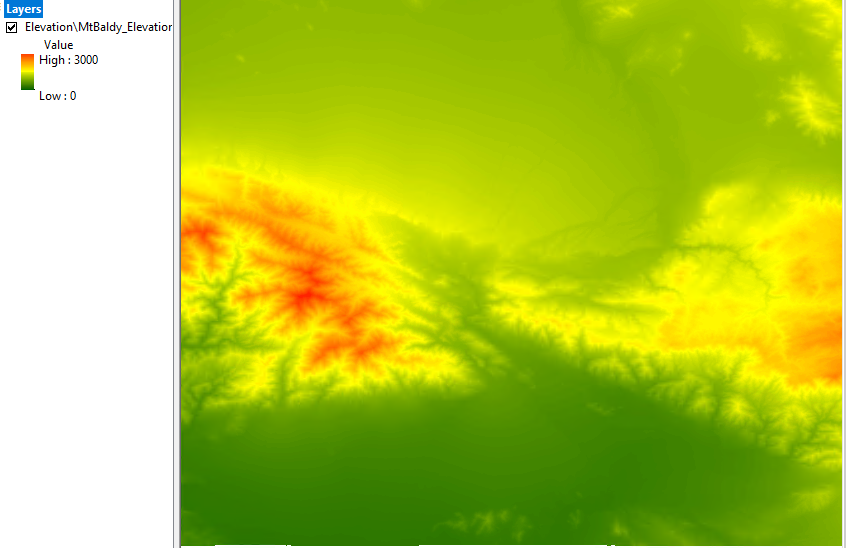
I expected that if I changed the statistics ```min``` or ```max``` values in my codePen the colors would change as per below from ArcMap:
Set to 0 - 3000
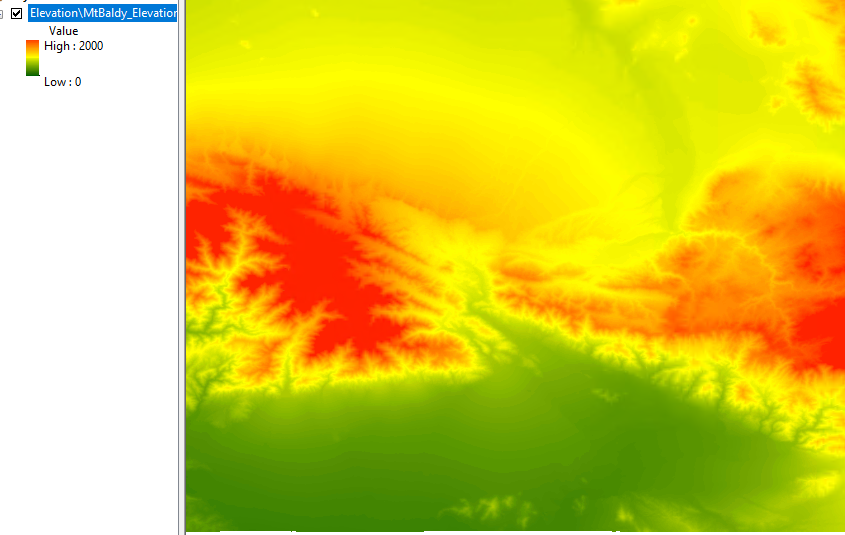
Now change the max to 2000:
I want my example to behave akin to this ESRI JS Sample when you adjust the slider on the "min-max" stretch type for a TileImageryLayer.
The statistics properties I'm setting have no effect. The stretch is always based on the min, max values of the data itself. I'm thinking the problem has something to do with me not understanding how to set that up. I've also looked at the OutputMin, OutputMax values, and can't understand what they are doing. Changing the latter has similar effects to above but the numbers are all wrong.
Any advice, thoughts is welcome.
Solved! Go to Solution.
Accepted Solutions
- Mark as New
- Bookmark
- Subscribe
- Mute
- Subscribe to RSS Feed
- Permalink
- Report Inappropriate Content
Hi there,
Thank you for the detailed explanation and reproducible case. It made is easy to track down the issue. You discovered an issue in the API. We will get this issue fixed and I will let you know once it is fixed.
So the problem you are running into is this. You are setting the renderer on the server side for an ImageryLayer via its raster functions. We are not converting the statistics object to the server side statistics properly. The renderer will work as expected if you change your statistics definition from:
statistics: [{
min: 500, //CHANGE ME, SEE IF COLORS CHANGE
max: 3000 //CHANGE ME, SEE IF COLORS CHANGE
}],
To:
//min, max, avg, stddev
statistics: [[500,3000, 1000, 505]] Hope this helps and thanks for bringing this issue to our attention.
-Undral
- Mark as New
- Bookmark
- Subscribe
- Mute
- Subscribe to RSS Feed
- Permalink
- Report Inappropriate Content
Thanks for your response and clarification. To be clear for anyone else looking at this: I don't think the "avg", "stddev" values have any effect on rendering using the "min/max" method; they just need to be set for the REST request to work properly. I believe it's sufficient to set them as 0 as a placeholder. Correct me if I'm wrong though.
Followup: If you have any advice on what OutputMin, OutputMax do that would be great. Documentation says:
The outputMin denotes the output minimum, which is the lowest pixel value for the histogram. The outputMin and outputMax will set the range of values that will then be linearly contrast stretched.
But its not clear to me how that is supposed to be used.
- Mark as New
- Bookmark
- Subscribe
- Mute
- Subscribe to RSS Feed
- Permalink
- Report Inappropriate Content
Hi there,
This issue will be fixed at 4.16 which is planned to be released sometime early July.
Thanks,
-Undral