- Home
- :
- All Communities
- :
- Developers
- :
- JavaScript Maps SDK
- :
- JavaScript Maps SDK Questions
- :
- How to hide unwanted tools in editor toolbar widge...
- Subscribe to RSS Feed
- Mark Topic as New
- Mark Topic as Read
- Float this Topic for Current User
- Bookmark
- Subscribe
- Mute
- Printer Friendly Page
How to hide unwanted tools in editor toolbar widget?
- Mark as New
- Bookmark
- Subscribe
- Mute
- Subscribe to RSS Feed
- Permalink
- Report Inappropriate Content
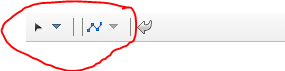
I need to customize the editor toolbar widget by hiding the list of unwanted tools for me in editor toolbar widget. Is there way I could get this done deactivating and hiding such tools in javascript or css?. It seems like those tools came as default in editor widget. However I was able to remove the display of some tools/buttons in dropdown like delete, AddToSelection, NewSelection, Attributes, ClearSelection. Here is the remaining buttons/tools that I wanted to hide or remove from the widget for my application and only keep undo/redo button. Appreciate for any help. Thanks
Solved! Go to Solution.
Accepted Solutions
- Mark as New
- Bookmark
- Subscribe
- Mute
- Subscribe to RSS Feed
- Permalink
- Report Inappropriate Content
Kushendra,
Sure here is a sample that shows how:
<!DOCTYPE html>
<html>
<head>
<meta http-equiv="Content-Type" content="text/html; charset=utf-8">
<meta name="viewport" content="initial-scale=1, maximum-scale=1,user-scalable=no">
<title>Edit rivers and waterbodies</title>
<link rel="stylesheet" href="https://js.arcgis.com/3.18/dijit/themes/claro/claro.css">
<link rel="stylesheet" href="https://js.arcgis.com/3.18/esri/css/esri.css">
<style>
html,body{height:100%;width:100%;margin:0;overflow:hidden;}
#map{
padding:0;
}
#header{
font-size: 1.1em;
font-family: sans-serif;
padding-left: 1em;
padding-top:4px;
color:#660000;
}
.templatePicker {
border: none;
}
.dj_ie .infowindow .window .top .right .user .content { position: relative; }
.dj_ie .simpleInfoWindow .content { position: relative; }
</style>
<script src="https://js.arcgis.com/3.18/"></script>
<script>
var map;
require([
"esri/map",
"esri/tasks/GeometryService",
"esri/layers/ArcGISTiledMapServiceLayer",
"esri/layers/FeatureLayer",
"esri/Color",
"esri/symbols/SimpleMarkerSymbol",
"esri/symbols/SimpleLineSymbol",
"esri/dijit/editing/Editor",
"esri/dijit/editing/TemplatePicker",
"esri/config",
"dojo/i18n!esri/nls/jsapi",
"dojo/_base/array", "dojo/parser", "dojo/keys", "dojo/query", "dojo/dom-style",
"dijit/layout/BorderContainer", "dijit/layout/ContentPane",
"dojo/domReady!"
], function(
Map, GeometryService,
ArcGISTiledMapServiceLayer, FeatureLayer,
Color, SimpleMarkerSymbol, SimpleLineSymbol,
Editor, TemplatePicker,
esriConfig, jsapiBundle,
arrayUtils, parser, keys, query, domStyle
) {
parser.parse();
// snapping is enabled for this sample - change the tooltip to reflect this
jsapiBundle.toolbars.draw.start = jsapiBundle.toolbars.draw.start + "<br>Press <b>ALT</b> to enable snapping";
// refer to "Using the Proxy Page" for more information: https://developers.arcgis.com/javascript/3/jshelp/ags_proxy.html
esriConfig.defaults.io.proxyUrl = "/proxy/";
//This service is for development and testing purposes only. We recommend that you create your own geometry service for use within your applications.
esriConfig.defaults.geometryService = new GeometryService("https://utility.arcgisonline.com/ArcGIS/rest/services/Geometry/GeometryServer");
map = new Map("map", {
basemap: "satellite",
center: [-96.541, 38.351],
zoom: 14,
slider: false
});
map.on("layers-add-result", initEditor);
//add boundaries and place names
var labels = new ArcGISTiledMapServiceLayer("https://server.arcgisonline.com/ArcGIS/rest/services/Reference/World_Boundaries_and_Places/MapServer");
map.addLayer(labels);
var responsePoints = new FeatureLayer("https://sampleserver6.arcgisonline.com/arcgis/rest/services/Wildfire/FeatureServer/0", {
mode: FeatureLayer.MODE_ONDEMAND,
outFields: ['*']
});
var responsePolys = new FeatureLayer("https://sampleserver6.arcgisonline.com/arcgis/rest/services/Wildfire/FeatureServer/2", {
mode: FeatureLayer.MODE_ONDEMAND,
outFields: ['*']
});
map.addLayers([responsePolys, responsePoints]);
function initEditor(evt) {
var templateLayers = arrayUtils.map(evt.layers, function(result){
return result.layer;
});
var templatePicker = new TemplatePicker({
featureLayers: templateLayers,
grouping: true,
rows: "auto",
columns: 3
}, "templateDiv");
templatePicker.startup();
var layers = arrayUtils.map(evt.layers, function(result) {
return { featureLayer: result.layer };
});
var settings = {
map: map,
templatePicker: templatePicker,
layerInfos: layers,
toolbarVisible: true,
createOptions: {
polylineDrawTools:[ Editor.CREATE_TOOL_FREEHAND_POLYLINE ],
polygonDrawTools: [ Editor.CREATE_TOOL_FREEHAND_POLYGON,
Editor.CREATE_TOOL_CIRCLE,
Editor.CREATE_TOOL_TRIANGLE,
Editor.CREATE_TOOL_RECTANGLE
]
},
toolbarOptions: {
reshapeVisible: false
}
};
var params = { settings: settings };
var myEditor = new Editor(params, 'editorDiv');
//define snapping options
var symbol = new SimpleMarkerSymbol(
SimpleMarkerSymbol.STYLE_CROSS,
15,
new SimpleLineSymbol(
SimpleLineSymbol.STYLE_SOLID,
new Color([255, 0, 0, 0.5]),
5
),
null
);
map.enableSnapping({
snapPointSymbol: symbol,
tolerance: 20,
snapKey: keys.ALT
});
myEditor.startup();
query(".dijit.dijitReset.dijitInline.dijitLeft.dijitComboButton", myEditor.domNode).forEach(function(node){
domStyle.set(node, "display", "none");
});
}
});
</script>
</head>
<body class="claro">
<div id="main" data-dojo-type="dijit/layout/BorderContainer" data-dojo-props="design:'headline'" style="height:width:100%;height:100%;">
<div data-dojo-type="dijit/layout/ContentPane" id="header" data-dojo-props="region:'top'">
Edit Hydrography
</div>
<div data-dojo-type="dijit/layout/ContentPane" data-dojo-props="region:'left'" style="width: 300px;overflow:hidden;">
<div id="templateDiv"></div>
<div id="editorDiv"></div>
</div>
<div data-dojo-type="dijit/layout/ContentPane" id="map" data-dojo-props="region:'center'"></div>
</div>
</body>
</html>- Mark as New
- Bookmark
- Subscribe
- Mute
- Subscribe to RSS Feed
- Permalink
- Report Inappropriate Content
Thanks for the sending the sample Robert. It works great with the simple toolbar sample. When I tried to put on my template which is using default editing widget, I still see the toolbar visible. I am using editor widget without having template picker and I don't know if it is causing an issue. All I embed was this piece of code including the module ( "dojo/_base/array",
"dojo/parser",
"dojo/keys",
"dojo/query",
"dojo/dom-style") : query(".dijit.dijitReset.dijitInline.dijitLeft.dijitComboButton", myEditor.domNode).forEach(function(node){
domStyle.set(node, "display", "none");
});
I tried using this code on esri default editor widget sample ArcGIS API for JavaScript Sandbox ; it seems it is not working.
- Mark as New
- Bookmark
- Subscribe
- Mute
- Subscribe to RSS Feed
- Permalink
- Report Inappropriate Content
Kushendra,
I am confused as that sample does not even show the toolbar.
- Mark as New
- Bookmark
- Subscribe
- Mute
- Subscribe to RSS Feed
- Permalink
- Report Inappropriate Content
Robert, I activated the toolbar inside the settings variable and checked to see if works since I am using the default editor widget sample for my template.
var settings = {
map: map,
layerInfos: featureLayerInfos,
toolbarVisible: true,
toolbarOptions: {
reshapeVisible: false
}
};
It displays the toolbar and when I tried using modules and put the snippet you sent in the sample doesn't work for this template (default editor widget). I don't know the issue behind since both the editor widget template and simple editor toolbar are similar to me as I am fairly new to the arcgis javascript world 
- Mark as New
- Bookmark
- Subscribe
- Mute
- Subscribe to RSS Feed
- Permalink
- Report Inappropriate Content
Kushendra,
OK you must of had something off in you code then. Here is a working example for the editor widget:
<!DOCTYPE html>
<html>
<head>
<meta http-equiv="Content-Type" content="text/html; charset=utf-8">
<meta name="viewport" content="initial-scale=1, maximum-scale=1,user-scalable=no">
<title>Default Editor</title>
<link rel="stylesheet" href="https://js.arcgis.com/3.18/dijit/themes/claro/claro.css">
<link rel="stylesheet" href="https://js.arcgis.com/3.18/esri/css/esri.css">
<style>
html, body {
height: 100%;
width: 100%;
margin: 0;
}
body {
background-color: #fff;
overflow: hidden;
font-family: Helvetica, san-serif;
}
#templatePickerPane {
width: 225px;
overflow: hidden;
}
#panelHeader {
background-color: #92A661;
border-bottom: solid 1px #92A860;
color: #FFF;
font-size: 18px;
height: 24px;
line-height: 22px;
margin: 0;
overflow: hidden;
padding: 10px 10px 10px 10px;
}
#map {
margin-right: 5px;
padding: 0;
}
.esriEditor .templatePicker {
padding-bottom: 5px;
padding-top: 5px;
height: 500px;
border-radius: 0px 0px 4px 4px;
border: solid 1px #92A661;
}
.dj_ie .infowindow .window .top .right .user .content, .dj_ie .simpleInfoWindow .content {
position: relative;
}
</style>
<script src="https://js.arcgis.com/3.18/"></script>
<script>
var map;
require([
"esri/config",
"esri/map",
"esri/SnappingManager",
"esri/dijit/editing/Editor",
"esri/layers/FeatureLayer",
"esri/tasks/GeometryService",
"esri/toolbars/draw",
"dojo/keys",
"dojo/parser",
"dojo/_base/array",
"dojo/i18n!esri/nls/jsapi",
"dojo/query",
"dojo/dom-style",
"dijit/layout/BorderContainer",
"dijit/layout/ContentPane",
"dojo/domReady!"
], function (
esriConfig, Map, SnappingManager, Editor, FeatureLayer, GeometryService,
Draw, keys, parser, arrayUtils, i18n, query, domStyle
) {
parser.parse();
//snapping is enabled for this sample - change the tooltip to reflect this
i18n.toolbars.draw.start += "<br/>Press <b>CTRL</b> to enable snapping";
i18n.toolbars.draw.addPoint += "<br/>Press <b>CTRL</b> to enable snapping";
//This sample requires a proxy page to handle communications with the ArcGIS Server services. You will need to
//replace the url below with the location of a proxy on your machine. See the 'Using the proxy page' help topic
//for details on setting up a proxy page.
esriConfig.defaults.io.proxyUrl = "/proxy/";
//This service is for development and testing purposes only. We recommend that you create your own geometry service for use within your applications
esriConfig.defaults.geometryService = new GeometryService("https://utility.arcgisonline.com/ArcGIS/rest/services/Geometry/GeometryServer");
map = new Map("map", {
basemap: "topo",
center: [-77.036, 38.891],
zoom: 16
});
map.on("layers-add-result", initEditing);
var operationsPointLayer = new FeatureLayer("https://services5.arcgis.com/lVkj5PBOw7tRmIPU/arcgis/rest/services/HSEC/FeatureServer/0", {
mode: FeatureLayer.MODE_ONDEMAND,
outFields: ["*"]
});
var operationsLineLayer = new FeatureLayer("https://services5.arcgis.com/lVkj5PBOw7tRmIPU/arcgis/rest/services/HSEC/FeatureServer/1",{
mode: FeatureLayer.MODE_ONDEMAND,
outFields: ["*"]
});
var operationsPolygonLayer = new FeatureLayer("https://services5.arcgis.com/lVkj5PBOw7tRmIPU/arcgis/rest/services/HSEC/FeatureServer/3", {
mode: FeatureLayer.MODE_ONDEMAND,
outFields: ["*"]
});
map.addLayers([
operationsPointLayer, operationsPolygonLayer, operationsLineLayer
]);
map.infoWindow.resize(400, 300);
function initEditing (event) {
var featureLayerInfos = arrayUtils.map(event.layers, function (layer) {
return {
"featureLayer": layer.layer
};
});
var settings = {
map: map,
layerInfos: featureLayerInfos,
toolbarVisible: true,
toolbarOptions: {
reshapeVisible: false
}
};
var params = {
settings: settings
};
var editorWidget = new Editor(params, 'editorDiv');
editorWidget.startup();
query(".dijit.dijitReset.dijitInline.dijitLeft.dijitComboButton", editorWidget.domNode).forEach(function(node){
domStyle.set(node, "display", "none");
});
//snapping defaults to Cmd key in Mac & Ctrl in PC.
//specify "snapKey" option only if you want a different key combination for snapping
map.enableSnapping();
}
});
</script>
</head>
<body class="claro">
<div id="mainWindow" data-dojo-type="dijit/layout/BorderContainer" data-dojo-props="design:'headline',gutters:false" style="width:100%; height:100%;">
<div id="map" data-dojo-type="dijit/layout/ContentPane" data-dojo-props="region:'center'">
</div>
<div data-dojo-type="dijit/layout/ContentPane" id="templatePickerPane" data-dojo-props="region:'left'">
<div id="panelHeader">
Default Editor
</div>
<div style="padding:10px;" id="editorDiv">
</div>
</div>
</div>
</body>
</html>- Mark as New
- Bookmark
- Subscribe
- Mute
- Subscribe to RSS Feed
- Permalink
- Report Inappropriate Content
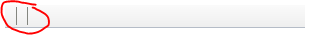
Robert, I was able to hide all the tools but the separator line. Is there way I can get rid of toolbar separator? I use css code to hide this separator line but as soon as I stop and start my editor window it continue display. Looking forward to your help.
here is the CSS:
#dijit_ToolbarSeparator_0.dijitToolbarSeparator.dijitInline {
display: none;
}
- Mark as New
- Bookmark
- Subscribe
- Mute
- Subscribe to RSS Feed
- Permalink
- Report Inappropriate Content
You can add the following javascript at line 144 of Robert's sample to hide the separator.
query(".dijitToolbarSeparator").style("display", "none");Alternatively if you only want undo/redo capability then you may want to turn off the editor toolbar and just add in the undo/redo capability. Here's a sample that shows how this works with graphics:
- Mark as New
- Bookmark
- Subscribe
- Mute
- Subscribe to RSS Feed
- Permalink
- Report Inappropriate Content
Thanks for the javascript line Kelly. Appreciated.
- Mark as New
- Bookmark
- Subscribe
- Mute
- Subscribe to RSS Feed
- Permalink
- Report Inappropriate Content
It works great Robert! There was the small error on my code. I really appreciated your time looking into this and solving my problem. Thank you.
Happy Thanksgiving!
Kush