- Home
- :
- All Communities
- :
- Developers
- :
- JavaScript Maps SDK
- :
- JavaScript Maps SDK Questions
- :
- Re: how to add graphics to selected object in data...
- Subscribe to RSS Feed
- Mark Topic as New
- Mark Topic as Read
- Float this Topic for Current User
- Bookmark
- Subscribe
- Mute
- Printer Friendly Page
how to add graphics to selected object in data grid.
- Mark as New
- Bookmark
- Subscribe
- Mute
- Subscribe to RSS Feed
- Permalink
- Report Inappropriate Content
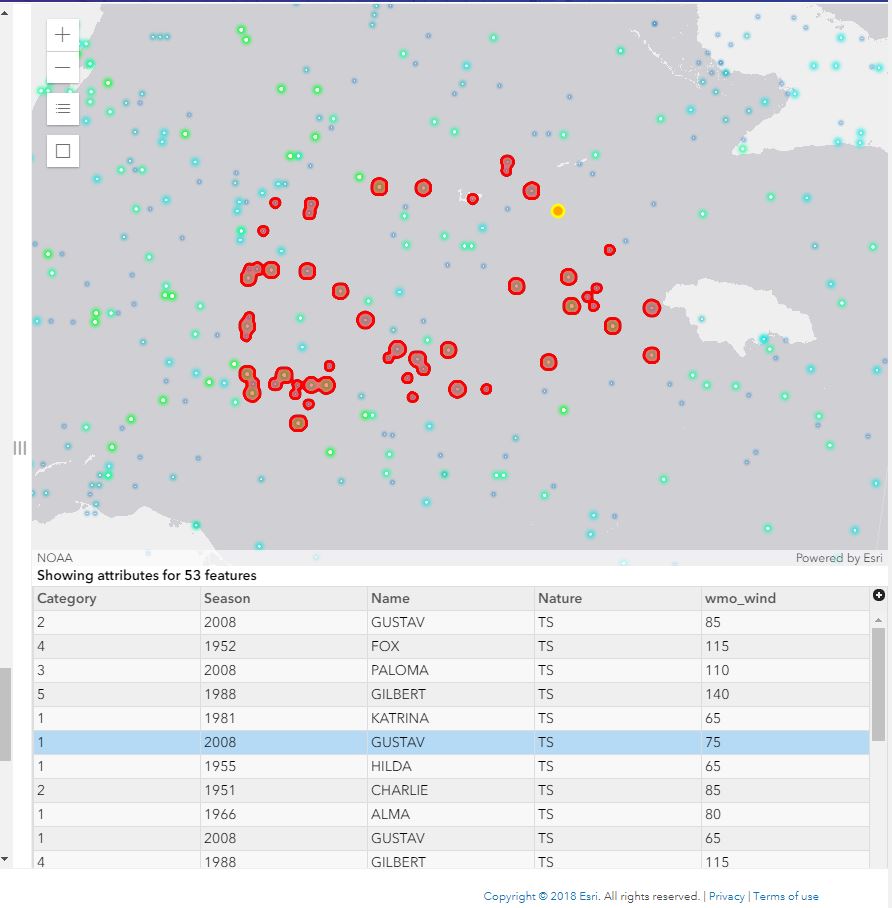
How to add a graphics to selected object...So after performing query task, when we click on any record in grid it highlights that specific record on map with specific color..
i tried this with using
popup: {
highlightEnabled: true,
dockEnabled: true,
dockOptions: {
position: "top-right",
breakpoint: true
}
}
refering sample
https://developers.arcgis.com/javascript/latest/sample-code/sandbox/index.html?sample=highlight-feat...
am expecting the graphics like below image..
Solved! Go to Solution.
Accepted Solutions
- Mark as New
- Bookmark
- Subscribe
- Mute
- Subscribe to RSS Feed
- Permalink
- Report Inappropriate Content
RAJ,
Here is a sample for that:
<!DOCTYPE html>
<html>
<head>
<meta charset="utf-8">
<meta name="viewport" content="initial-scale=1,maximum-scale=1,user-scalable=no">
<title>QueryTask - 4.8</title>
<style>
html,
body,
#viewDiv {
padding: 0;
margin: 0;
height: 100%;
width: 100%;
overflow: hidden;
}
#viewDiv.withGrid {
height: 65%;
}
.esri-widget {
padding-left: 8px;
padding-right: 4px;
}
#paneDiv {
position: absolute;
top: 10px;
left: 62px;
padding: 0 12px 0 12px;
background-color: rgba(0, 0, 0, 0.5);
color: white;
}
#gridDisplay {
position: absolute;
bottom: 0;
left: 0;
height: 35%;
background-color: white;
border-color: grey;
width: 100%;
font-family: "Avenir Next W00", "Helvetica Neue", Helvetica, Arial, sans-serif;
font-size: 14px;
display: none;
}
#gridDisplay {
z-index: 80;
}
.info {
line-height: 20px;
padding-left: 5px ! important;
}
.dgrid-header,
.dgrid-header-row {
background-color: #eee;
color: #57585A;
}
.dgrid-row-even {
background-color: #F7F8F8;
}
.dgrid-row-odd {
background-color: #EFEFEF;
}
.dgrid-selected {
background: #B4DAF5;
}
.dgrid-row {
border: none
}
</style>
<link rel="stylesheet" href="https://js.arcgis.com/4.8/esri/css/main.css">
<script src="https://js.arcgis.com/4.8/"></script>
<script>
require([
"esri/Map",
"esri/views/MapView",
"esri/widgets/Home",
"esri/widgets/Legend",
"esri/widgets/Search",
"esri/layers/GraphicsLayer",
"esri/Graphic",
"esri/tasks/QueryTask",
"esri/tasks/support/Query",
"dojo/_base/array",
"dojo/dom",
"dojo/on",
"dgrid/OnDemandGrid",
"dgrid/extensions/ColumnHider",
"dojo/store/Memory",
"dstore/legacy/StoreAdapter",
"dgrid/Selection",
"dojo/_base/declare",
"dojo/dom-class",
"dojo/domReady!"
],
function(
Map, MapView, Home, Legend, Search, GraphicsLayer, Graphic, QueryTask, Query, arrayUtils, dom, on,
OnDemandGrid, ColumnHider, Memory, StoreAdapter, Selection, declare, domClass
) {
let map, view, grid;
let RUrl = "https://services.arcgis.com/V6ZHFr6zdgNZuVG0/arcgis/rest/services/Prominent_Peaks_US/FeatureServer/0";
let FUrl = "https://services.arcgis.com/V6ZHFr6zdgNZuVG0/ArcGIS/rest/services/2015_06_26_active_fires_USA_contig...";
let gridFields = ["OBJECTID", "RANK", "MTN_PEAK", "STATE",
"ELEV_ft", "ELEV_m" ,"PROMINENCE_ft" ,"PROMINENCE_m"
];
// create a new datastore for the on demandgrid
// will be used to display attributes of selected features
let dataStore = new StoreAdapter({
objectStore: new Memory({
idProperty: "OBJECTID"
})
});
const gridDis = document.getElementById("gridDisplay");
// Define the popup content for each result
const popupTemplate = { // autocasts as new PopupTemplate()
title: "{MTN_PEAK}, {STATE}",
fieldInfos: [{
fieldName: "ELEV_ft",
label: "Elevation (feet)",
format: {
places: 0,
digitSeperator: true
}
}, {
fieldName: "ELEV_m",
label: "Elevation (meters)",
format: {
places: 0,
digitSeperator: true
}
}, {
fieldName: "PROMINENCE_ft",
label: "Prominence (feet)",
format: {
places: 0,
digitSeperator: true
}
}, {
fieldName: "PROMINENCE_m",
label: "Prominence (meters)",
format: {
places: 0,
digitSeperator: true
}
}, {
fieldName: "ISOLATION_mi",
label: "Isolation (miles)",
format: {
places: 0,
digitSeperator: true
}
}, {
fieldName: "ISOLATION_km",
label: "Isolation (km)",
format: {
places: 0,
digitSeperator: true
}
}],
content: "<b><a href='https://en.wikipedia.org/wiki/Topographic_prominence'>Prominence:</a>" +
"</b> {PROMINENCE_ft} ft ({PROMINENCE_m} m)" +
"<br><b>Prominence Rank:</b> {RANK}" +
"<br><b>Elevation:</b> {ELEV_ft} ft ({ELEV_m} m)" +
"<br><b><a href='https://en.wikipedia.org/wiki/Topographic_isolation'>Isolation:</a>" +
"</b> {ISOLATION_mi} mi ({ISOLATION_km} km)"
};
// Define the popup content for each result
const popupTemplate2 = { // autocasts as new PopupTemplate()
title: "{TRACK}",
fieldInfos: [{
fieldName: "TRACK",
label: "Track"
}, {
fieldName: "BRIGHT_T31",
label: "Brightness",
format: {
places: 0,
digitSeperator: true
}
}, {
fieldName: "CONFIDENCE",
label: "Confidence"
}, {
fieldName: "SCAN",
label: "Scan",
format: {
places: 0,
digitSeperator: true
}
}],
content: "Brightness: {BRIGHT_T31}" +
"<br><b>Prominence Rank:</b> {RANK}" +
"<br><b>Confidence:</b> {CONFIDENCE}" +
"<br><b>Scan: {SCAN}"
};
let resultsLayer = new GraphicsLayer();
let resultsLayer2 = new GraphicsLayer();
let qTask = new QueryTask({
url: RUrl
});
let qTask2 = new QueryTask({
url: FUrl
});
let params = new Query({
returnGeometry: true
});
map = new Map({
basemap: "streets",
layers: [resultsLayer, resultsLayer2]
});
view = new MapView({
map: map,
container: "viewDiv",
zoom: 11,
popup: {
dockEnabled: true,
dockOptions: {
position: "top-right",
breakpoint: false
}
}
});
function createGrid(fields) {
var columns = fields.filter(function(field, i) {
if (gridFields.indexOf(field.name) !== -1) {
return field;
}
}).map(function(field) {
if (field.name === "OBJECTID") {
return {
field: field.name,
label: field.name,
sortable: true,
// hidden: true
};
} else {
return {
field: field.name,
label: field.alias,
sortable: true
};
}
});
// create a new onDemandGrid with its selection and columnhider
// extensions. Set the columns of the grid to display attributes
// the hurricanes cvslayer
grid = new(declare([OnDemandGrid, Selection, ColumnHider]))({
columns: columns
}, "grid");
// add a row-click listener on the grid. This will be used
// to highlight the corresponding feature on the view
grid.on("dgrid-select", selectFeatureFromGrid);
}
function selectFeatureFromGrid(event) {
// close view popup if it is open
view.popup.close();
// get the ObjectID value from the clicked row
var row = event.rows[0]
var id = row.data.OBJECTID;
// setup a query by specifying objectIds
var query = {
objectIds: [parseInt(id)],
outFields: ["*"],
returnGeometry: true,
outSpatialReference: view.spatialReference
};
if(wlayer.value === 'peaks'){
qTask.execute(query).then(function(results){
const graphics = results.features;
// remove all graphics to make sure no selected graphics
view.graphics.removeAll();
// create a new selected graphic
var selectedGraphic = new Graphic({
geometry: graphics[0].geometry,
symbol: {
type: "simple-marker",
style: "circle",
color: "orange",
size: "12px", // pixels
outline: { // autocasts as new SimpleLineSymbol()
color: [255, 255, 0],
width: 2 // points
}
}
});
// add the selected graphic to the view
// this graphic corresponds to the row that was clicked
view.graphics.add(selectedGraphic);
})
}else if(wlayer.value === 'fires'){
qTask2.execute(query).then(function(results){
const graphics2 = results.features;
// remove all graphics to make sure no selected graphics
view.graphics.removeAll();
// create a new selected graphic
var selectedGraphic = new Graphic({
geometry: graphics2[0].geometry,
symbol: {
type: "simple-marker",
style: "circle",
color: "orange",
size: "12px", // pixels
outline: { // autocasts as new SimpleLineSymbol()
color: [255, 255, 0],
width: 2 // points
}
}
});
// add the selected graphic to the view
// this graphic corresponds to the row that was clicked
view.graphics.add(selectedGraphic);
})
}
}
view.when(function() {
view.ui.add("optionsDiv", "bottom-right");
on(dom.byId("doBtn"), "click", doQuery);
on(dom.byId("clrBtn"), "click", doClear);
});
const attributeName = dom.byId("attSelect");
const expressionSign = dom.byId("signSelect");
const value = dom.byId("valSelect");
const wlayer = dom.byId("lyrSelect");
function doClear() {
if(grid){
dataStore.objectStore.data = {};
grid.set("collection", dataStore);
}
resultsLayer2.removeAll();
gridDis.style.display = 'none';
domClass.remove("viewDiv", 'withGrid');
}
function doQuery() {
doClear();
// Clear the results from a previous query
resultsLayer.removeAll();
resultsLayer2.removeAll();
params.where = attributeName.value + expressionSign.value + value.value;
if(wlayer.value === 'peaks'){
params.outFields = ["*"];
gridFields = ["OBJECTID", "RANK", "MTN_PEAK", "STATE",
"ELEV_ft", "ELEV_m" ,"PROMINENCE_ft" ,"PROMINENCE_m"
];
qTask.execute(params)
.then(getResults)
.catch(promiseRejected);
}else if(wlayer.value === 'fires'){
params.outFields = ["*"];
gridFields = ["OBJECTID", "BRIGHTNESS", "SCAN", "TRACK",
"ACQ_DATE", "ACQ_TIME", "SATELLITE", "CONFIDENCE", "VERSION"
];
params.where = 'BRIGHTNESS > 320';
qTask2.execute(params)
.then(getResults)
.catch(promiseRejected);
}
}
function getResults(response) {
let graphics = response.features;
if (graphics.length > 0) {
gridDis.style.display = 'block';
domClass.add("viewDiv", 'withGrid');
document.getElementById("featureCount").innerHTML =
"<b>Showing attributes for " +
graphics.length.toString() + " features </b>"
} else {
gridDis.style.display = 'none';
}
createGrid(response.fields);
// get the attributes to display in the grid
var data = graphics.map(function(feature, i) {
return Object.keys(feature.attributes)
.filter(function(key) {
// get fields that exist in the grid
return (gridFields.indexOf(key) !== -1);
})
// need to create key value pairs from the feature
// attributes so that info can be displayed in the grid
.reduce((obj, key) => {
obj[key] = feature.attributes[key];
return obj;
}, {});
});
// set the datastore for the grid using the
// attributes we got for the query results
dataStore.objectStore.data = data;
grid.set("collection", dataStore);
var RResults = arrayUtils.map(response.features, function(
feature) {
feature.symbol = {
type: "simple-marker",
color: "red",
size: 5,
outline: {
color: "black"
}
};
if(wlayer.value === 'peaks'){
feature.popupTemplate = popupTemplate;
}else if(wlayer.value === 'fires'){
feature.popupTemplate = popupTemplate2;
}
return feature;
});
if(wlayer.value === 'peaks'){
resultsLayer.addMany(RResults);
}else if(wlayer.value === 'fires'){
resultsLayer2.addMany(RResults);
}
view.goTo(RResults);
}
function promiseRejected(error) {
console.error("Promise rejected: ", error.message);
}
var homeBtn = new Home({
view: view
}, "homeDiv");
var legend = new Legend({
view: view,
layerInfos: [{
url: RUrl
}]
});
legend.startup();
view.ui.add(legend, "bottom-left");
var searchWidget = new Search({
view: view
});
view.ui.add(searchWidget, {
position: "top-right"
});
});
</script>
</head>
<body>
<div id="viewDiv">
<div class="esri-widget" id="optionsDiv">
<h2>Prominent Peaks in the U.S.</h2>
<select class="esri-widget" id="lyrSelect">
<option value="fires">US Fires</option>
<option value="peaks" selected>US Peaks</option>
</select>
<select class="esri-widget" id="attSelect">
<option value="ELEV_ft">Elevation</option>
<option value="PROMINENCE_ft" selected>Prominence</option>
</select>
<select class="esri-widget" id="signSelect">
<option value=">">is greater than</option>
<option value="<">is less than</option>
<option value="=">is equal to</option>
</select>
<select class="esri-widget" id="valSelect">
<option value="1000">1,000 ft</option>
<option value="5000">5,000 ft</option>
<option value="10000">10,000 ft</option>
<option value="15000">15,000 ft</option>
<option value="20000">20,000 ft</option>
</select>
<br>
<br>
<button class="esri-widget" id="doBtn">Do Query</button>
<button class="esri-widget" id="clrBtn">Clear</button>
<br>
<br>
</div>
<div id="gridDisplay">
<span class="info" id="featureCount"></span>
<div id="grid"></div>
</div>
</div>
</body>
</html>
- Mark as New
- Bookmark
- Subscribe
- Mute
- Subscribe to RSS Feed
- Permalink
- Report Inappropriate Content
Thanks a lot for the solution Roberts..Really appreciate that..
- Mark as New
- Bookmark
- Subscribe
- Mute
- Subscribe to RSS Feed
- Permalink
- Report Inappropriate Content
Hi robert, I have a application code in which i am trying to improve 2-3 funtions. I think you are more familiar with these funtions. Can you help me with that.
- Mark as New
- Bookmark
- Subscribe
- Mute
- Subscribe to RSS Feed
- Permalink
- Report Inappropriate Content
Rocky,
Sure just start a new question.
- Mark as New
- Bookmark
- Subscribe
- Mute
- Subscribe to RSS Feed
- Permalink
- Report Inappropriate Content
I cant able to share it here. I want to show it to you only.. I hope you understand..If possible, can you please share me any temporary mail Id..?
this ones mine namoraj96@gmail.com..
- Mark as New
- Bookmark
- Subscribe
- Mute
- Subscribe to RSS Feed
- Permalink
- Report Inappropriate Content
Or i can share you a link of code. If that is comfortable for you.. Please let me know how to share.. I need your help..
- Mark as New
- Bookmark
- Subscribe
- Mute
- Subscribe to RSS Feed
- Permalink
- Report Inappropriate Content
Rocky,
I do not help people by email. I only use GeoNet.
- Mark as New
- Bookmark
- Subscribe
- Mute
- Subscribe to RSS Feed
- Permalink
- Report Inappropriate Content
Hi Robert, I ahve already created new question task on geonet. Can you please take a look.
https://community.esri.com/thread/225143-help-with-query-task-in-3d-view
- Mark as New
- Bookmark
- Subscribe
- Mute
- Subscribe to RSS Feed
- Permalink
- Report Inappropriate Content
Rocky,
That is a lot you are asking for in that thread. Basically you are asking for so much help, you should be looking to hire a consultant.