- Home
- :
- All Communities
- :
- Developers
- :
- JavaScript Maps SDK
- :
- JavaScript Maps SDK Questions
- :
- FlowRenderer RasterStretchRenderer ColorRamp not b...
- Subscribe to RSS Feed
- Mark Topic as New
- Mark Topic as Read
- Float this Topic for Current User
- Bookmark
- Subscribe
- Mute
- Printer Friendly Page
FlowRenderer RasterStretchRenderer ColorRamp not being applied on ImageryLayer
- Mark as New
- Bookmark
- Subscribe
- Mute
- Subscribe to RSS Feed
- Permalink
- Report Inappropriate Content
We set up AnimatedFlowRender with 4.22 and had no issues setting the raster-stretch type renderer's ColorRamp property using ImageryLayer layers. It seems that ImageryLayer in 4.23 does not apply the ColorRamp property for the RasterStretchRenderer to an ImageryLayer but does apply it to ImageryTileLayer.
I have confirmed this using the FlowRender codepen provided in the example at FlowRenderer with effects and blending | Sample Code | ArcGIS API for JavaScript 4.23 | ArcGIS Devel.... I can apply my ColorRamp to ESRI's data using ImageryTileLayer but cannot apply it to my data using ImageryLayer. ImageryLayer applies the service default color ramp. The layer's renderer object has all of the proper data in the ColorRamp object, but it is ignored. At this point, using a tiled image server is not an option.
Has anyone found a way around this? Our current undesirable options include:
- Using visualVariable and dynamically changing the stops according to min/max values and number of colors in the desired ramp.
-Set up multiple image servers with different default color ramps.
Solved! Go to Solution.
Accepted Solutions
- Mark as New
- Bookmark
- Subscribe
- Mute
- Subscribe to RSS Feed
- Permalink
- Report Inappropriate Content
Hi there,
You don't have to set bandIds or statistics when working with single band images. RasterStretchRenderer uses the statistics from the specified band or the only band by default. I suspect that your service's stats are maybe off. Can you try following two things?
1. Set the ImageryLayer.format to lerc so that the RasterStretchRenderer is applied on the client-side. if image formats are being requested, then the server processes the data and returns an image.
2. Can you set the stats on the RasterStretchRenderer and modify your stats as needed?
I updated the codepen to use single band image service and removed the flow-renderer part (but works with flow renderer as well). https://codepen.io/U_B_U/pen/gOvmmyr?editors=1000
I am setting the service's stats directly on the renderer to show how this is done. You can get the stats from the service rest end point or can get them from ImageryLayer.serviceRasterInfo. In any case, you probably have to play with the numbers.
const temperatureLayer = new ImageryLayer({
  url: "https://sampleserver6.arcgisonline.com/arcgis/rest/services/CharlotteLAS/ImageServer",
  renderer: {
    colorRamp,
    stretchType: "min-max",
    type: "raster-stretch",
    statistics: [{
      avg: 712.371337411377,
      max: 1611.125,
      min: 515.6699829101562,
      stddev: 45.56883666949917
     }]
   },
   format: "lerc"
});
- Mark as New
- Bookmark
- Subscribe
- Mute
- Subscribe to RSS Feed
- Permalink
- Report Inappropriate Content
Hi there,
You need to specify the bandIds on the ImageryLayer so that renderer uses the right band. We will update RasterStretchRenderer documentation to indicate that one needs to set the bandIds when working with multi-band image services. With that said, we will look into improving the current behavior.
I set up a simple codepen app: https://codepen.io/U_B_U/pen/VwQmPdg?editors=100
In this app, I am setting the bandIds to first band (magnitude band) and applying the raster stretch renderer. The color ramp is honored in this case.
- Mark as New
- Bookmark
- Subscribe
- Mute
- Subscribe to RSS Feed
- Permalink
- Report Inappropriate Content
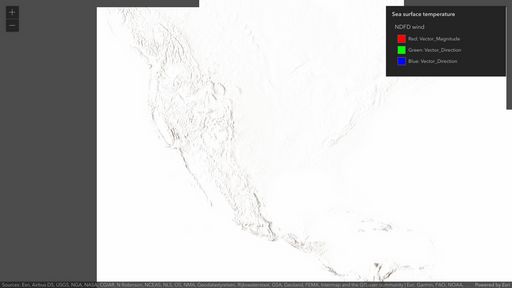
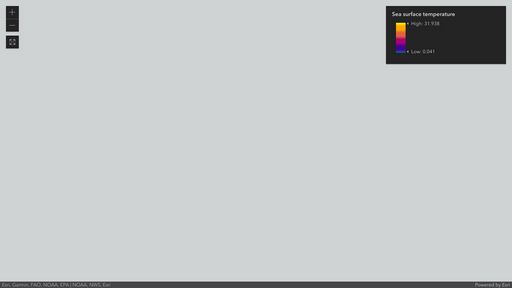
I tried that solution with our server url and got no joy. I have included a screen shot because you will not be able to access the service from your location. The legend reflects the color changes that I made, but the service does not. We (the team working on this project) tried changing the default colors of the service, but the API renders the same colors despite all efforts thus far.
There are some differences in implementation. We observed that you have the directional bands and and magnitude bands in the same service, but we use 2 difference services for the direction and magnitude. The magnitude has only one band, so specifying the band does not seem to change anything. We are open to trying any other ideas you may have. Thanks!
- Mark as New
- Bookmark
- Subscribe
- Mute
- Subscribe to RSS Feed
- Permalink
- Report Inappropriate Content
Hi there,
You don't have to set bandIds or statistics when working with single band images. RasterStretchRenderer uses the statistics from the specified band or the only band by default. I suspect that your service's stats are maybe off. Can you try following two things?
1. Set the ImageryLayer.format to lerc so that the RasterStretchRenderer is applied on the client-side. if image formats are being requested, then the server processes the data and returns an image.
2. Can you set the stats on the RasterStretchRenderer and modify your stats as needed?
I updated the codepen to use single band image service and removed the flow-renderer part (but works with flow renderer as well). https://codepen.io/U_B_U/pen/gOvmmyr?editors=1000
I am setting the service's stats directly on the renderer to show how this is done. You can get the stats from the service rest end point or can get them from ImageryLayer.serviceRasterInfo. In any case, you probably have to play with the numbers.
const temperatureLayer = new ImageryLayer({
  url: "https://sampleserver6.arcgisonline.com/arcgis/rest/services/CharlotteLAS/ImageServer",
  renderer: {
    colorRamp,
    stretchType: "min-max",
    type: "raster-stretch",
    statistics: [{
      avg: 712.371337411377,
      max: 1611.125,
      min: 515.6699829101562,
      stddev: 45.56883666949917
     }]
   },
   format: "lerc"
});
- Mark as New
- Bookmark
- Subscribe
- Mute
- Subscribe to RSS Feed
- Permalink
- Report Inappropriate Content
Manually adding the statistics has no bearing on the results. However, adding 'format: "lerc"' makes all the difference. This was not required in the .22 version, but it seems in the newer codebase, specifying the "lerc" format allows for client-side access to the data for rendering. Using that setting allows me to control the ColorRamp property. We couldn't find old documentation on ImageryLayer. Is the requirement to specify the format new for this code version or was there a bug that allowed us to not specify it but still access the ColorRamp?
- Mark as New
- Bookmark
- Subscribe
- Mute
- Subscribe to RSS Feed
- Permalink
- Report Inappropriate Content
Hi there,
I do not see any difference between 4.20, 4.21, 4.22 for RasterStretchRenderer with colorRamps being applied to ImageryLayer. The format default is jpgpng for most dynamic services unless the service has vector field data. Perhaps, 4.22 was able to understand one band vector field image service and requested the data in lerc format. Vector field image services mostly have two bands magnitude and direction. The renderer is applied on the client-side if we request the data in raw format of lerc. For image outputs, the server processes data. In any case, I will follow up with the server team to see what is going on this case.
- Mark as New
- Bookmark
- Subscribe
- Mute
- Subscribe to RSS Feed
- Permalink
- Report Inappropriate Content
Thank you for your assistance it solving this. The team is quite curious what caused the behavior change so please do update us with a response from the server team.
- Mark as New
- Bookmark
- Subscribe
- Mute
- Subscribe to RSS Feed
- Permalink
- Report Inappropriate Content
Hey @Brandon-Ellis
So I wanted to let you know what our tests did not show any behavior changes in different JS API or server versions.
In any case, server-side rendering requires the colorRamp to have algorithm specified. If not it ignores the0 colorRamp and creates black and white image. So we updated the JS API to add cie-lab algorithm by default if the algorithm is not specified. We also have updated the RasterStretchRenderer.colorRamp document to explain this new behavior and the doc change will show up at 4.24. Hope this helps
- Mark as New
- Bookmark
- Subscribe
- Mute
- Subscribe to RSS Feed
- Permalink
- Report Inappropriate Content
That's odd since we observed different behavior in the different versions.
Thank you for addressing the issue and getting the documentation updated to include ImageryLayer.format = lerc. The lack of serverside ramp specification was not our issue however and we never saw a black and white or grayscale ramp.
- Mark as New
- Bookmark
- Subscribe
- Mute
- Subscribe to RSS Feed
- Permalink
- Report Inappropriate Content
Brandon,
We changed the api code to have a default algorithm (tie-lab) for colorRamps. So hopefully you should not see a difference. You can test your app by pointing to <script src="https://js.arcgis.com/next/"></script>)
The changes will be on next version later on June 2nd. Please feel free to ping me if you still see issues.


