- Home
- :
- All Communities
- :
- Developers
- :
- JavaScript Maps SDK
- :
- JavaScript Maps SDK Questions
- :
- Dojox chart in panel
- Subscribe to RSS Feed
- Mark Topic as New
- Mark Topic as Read
- Float this Topic for Current User
- Bookmark
- Subscribe
- Mute
- Printer Friendly Page
- Mark as New
- Bookmark
- Subscribe
- Mute
- Subscribe to RSS Feed
- Permalink
- Report Inappropriate Content
I created a dojox chart using the Info window with chart tutorial.
I am using info window and the Measurement widget but this combination seems not to be working because every time you click to create a measurement the info window appears and covers your region of interest.
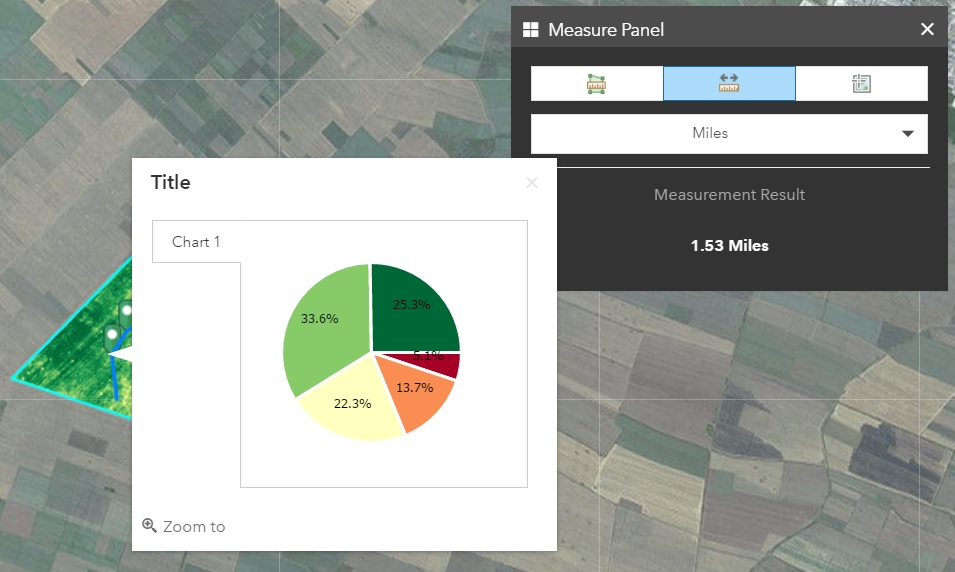
One solution would be to dock the popups but that is only available in JavaScript 4.x which does not support the Measurement widget.
So I guess I need to put the popups in a panel.
I used the sample code from the Popup content in side panel tutorial to integrate the popups in my Popup Panel but I am missing something in the code because it's not working.
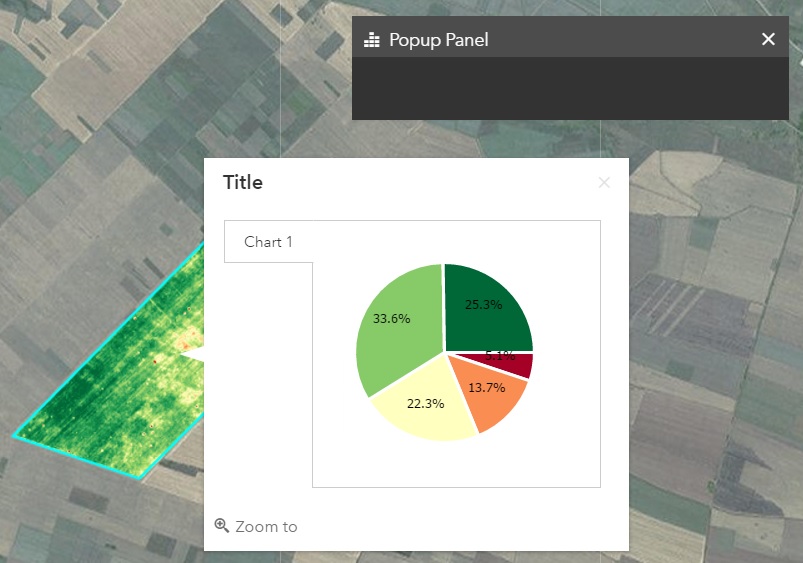
Any support with the code would be very helpful.
My map in the ESRI Calcite Maps theme is available on JS Bin.
// From tutorial "Popup content in side panel"
function(error){
console.log("Map creation failed: ", dojo.toJson(error));
...
</script>Thank you,
Michelle
Solved! Go to Solution.
- Mark as New
- Bookmark
- Subscribe
- Mute
- Subscribe to RSS Feed
- Permalink
- Report Inappropriate Content
Hi Robert,
I added the code after measurement and it doesn't seem to have an effect:
var measurement = new Measurement({
map: window.map,
}, dojo.byId('measurementDiv'));
measurement.startup();
aspect.after(measurement, 'setTool', function() {
if (measurement.activeTool) {
map.setInfoWindowOnClick(false);
} else {
map.setInfoWindowOnClick(true);
}
});Thank you,
Michelle
- Mark as New
- Bookmark
- Subscribe
- Mute
- Subscribe to RSS Feed
- Permalink
- Report Inappropriate Content
Michelle,
Did you add the require for aspect?
- Mark as New
- Bookmark
- Subscribe
- Mute
- Subscribe to RSS Feed
- Permalink
- Report Inappropriate Content
- Mark as New
- Bookmark
- Subscribe
- Mute
- Subscribe to RSS Feed
- Permalink
- Report Inappropriate Content
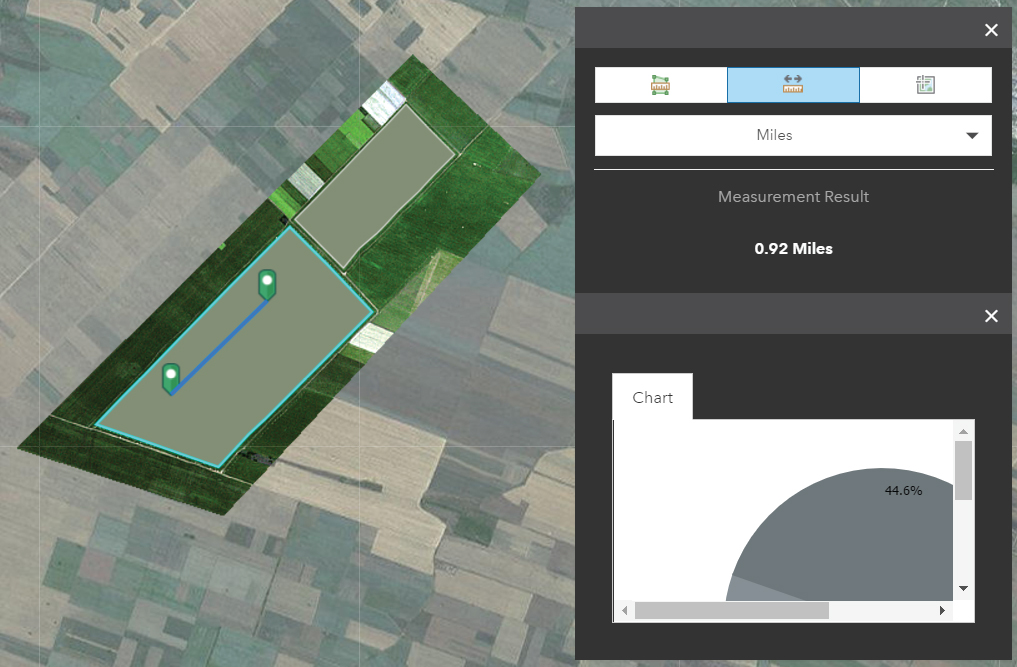
Michelle,
Because you where showing the chart based on a layer click event handler and not just using the layers popup you need to use on.pausable for the layers click event:
require([
"esri/layers/FeatureLayer",
"esri/dijit/Measurement",
"esri/InfoTemplate",
"dijit/layout/TabContainer",
"dijit/layout/ContentPane",
"dojo/dom-construct",
"dojo/dom-class",
"esri/arcgis/utils",
"dojo/query",
"dojo/on",
"dijit/registry",
"dojo/dom",
"calcite-maps/calcitemaps-v0.3",
"bootstrap/Collapse",
"bootstrap/Dropdown",
"bootstrap/Tab",
"dojo/Deferred",
"dojo/domReady!"
],
function(FeatureLayer, Measurement, InfoTemplate, TabContainer, ContentPane, domConstruct, domClass, arcgisUtils, query, on, registry, dom, CalciteMaps, Deferred) {
esri.config.defaults.io.proxyUrl = "http://gislap183/proxy/proxy.ashx";
esri.config.defaults.io.alwaysUseProxy = false;
esri.config.defaults.geometryService = new esri.tasks.GeometryService("https://utility.arcgisonline.com/ArcGIS/rest/services/Geometry/GeometryServer");
arcgisUtils.createMap("25bc5a52ccd746c89daefa179cae0036", "mapViewDiv", {
usePopupManager: true
}).then(function(response) {
window.map = response.map;
window.map.infoWindow.set("popupWindow", false);
initializeSidebar(window.map);
var statesLayer = new FeatureLayer("http://services7.arcgis.com/6FZUQ16zBFwjeNsQ/arcgis/rest/services/Feat_Lay_WFL/FeatureServer/0", {
outFields: ["*"]
});
var stateClickHandler = on.pausable(statesLayer, "click", generatePopup);
window.map.addLayer(statesLayer);
function generatePopup(evt) {
require(["app/CreateChart"], function(CreateChart) {
if(!CreateChart) {
console.log("Module not loaded");
return;
}
var chart = new CreateChart({
graphic: evt.graphic
});
var chartContent = chart.createPieChart();
window.map.infoWindow.setFeatures([evt.graphic]);
if(!domClass.contains(query("#panelPopup")[0], "in")) {
query("#panelPopup").collapse("toggle");
}
registry.byId("chartPanel").set("content", chartContent);
});
}
var measurement = new Measurement({
map: window.map,
}, dojo.byId('measurementDiv'));
measurement.startup();
// ------------ disable chart when using Measurement Widget -----------------------------------
aspect.after(measurement, 'setTool', function() {
if(measurement.activeTool) {
stateClickHandler.pause();
} else {
stateClickHandler.resume();
}
});
// --------------------------------------------------------------------------------------------
},
function(error) {
console.log("Map creation failed: ", dojo.toJson(error));
}
);
function initializeSidebar(map) {
var lp = new ContentPane({
style: "height:235"
}, dom.byId("chartPanel"));
lp.startup();
}
}
);
- Mark as New
- Bookmark
- Subscribe
- Mute
- Subscribe to RSS Feed
- Permalink
- Report Inappropriate Content
Thank you Robert 
- « Previous
-
- 1
- 2
- Next »
- « Previous
-
- 1
- 2
- Next »