- Home
- :
- All Communities
- :
- Developers
- :
- JavaScript Maps SDK
- :
- JavaScript Maps SDK Questions
- :
- Ctrl + Mouse click
- Subscribe to RSS Feed
- Mark Topic as New
- Mark Topic as Read
- Float this Topic for Current User
- Bookmark
- Subscribe
- Mute
- Printer Friendly Page
- Mark as New
- Bookmark
- Subscribe
- Mute
- Subscribe to RSS Feed
- Permalink
- Report Inappropriate Content
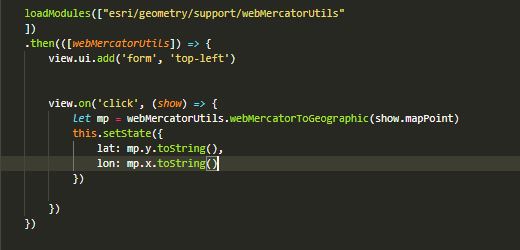
Hi
I want to use Ctrl key with mouse click to get coordinates. Following snapshot is working well on mouse click, is there any way to modify this code with Ctrl key????
Solved! Go to Solution.
Accepted Solutions
- Mark as New
- Bookmark
- Subscribe
- Mute
- Subscribe to RSS Feed
- Permalink
- Report Inappropriate Content
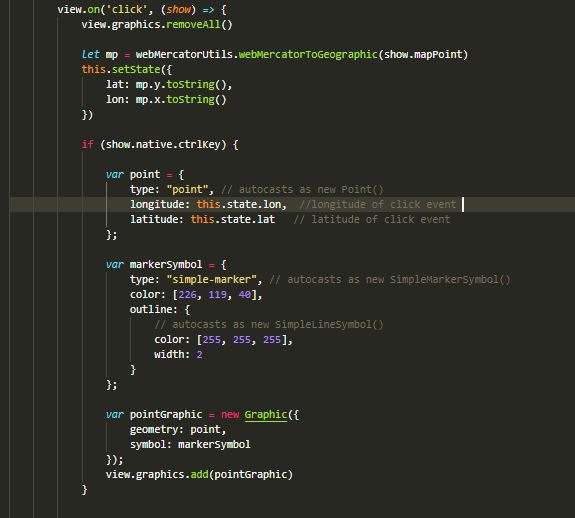
Kawish,
The ctrl key is part of the native object in your "show" object.
view.on('click', function(show){
console.info(show.native.ctrlKey);
});- Mark as New
- Bookmark
- Subscribe
- Mute
- Subscribe to RSS Feed
- Permalink
- Report Inappropriate Content
Kawish,
The ctrl key is part of the native object in your "show" object.
view.on('click', function(show){
console.info(show.native.ctrlKey);
});- Mark as New
- Bookmark
- Subscribe
- Mute
- Subscribe to RSS Feed
- Permalink
- Report Inappropriate Content
Thank you Robert Scheitlin, GISP.
Can you solve another problem. i have added point with "Ctrl + mouse click" to map but i want to remove that point after 5 second or 3 second.
How is it possible??.
- Mark as New
- Bookmark
- Subscribe
- Mute
- Subscribe to RSS Feed
- Permalink
- Report Inappropriate Content
Kawish,
Sure just add a setTimeout to the end of your code that removes the graphic.
setTimeout(function(){
view.graphics.remove(pointGraphic);
}, 5000);- Mark as New
- Bookmark
- Subscribe
- Mute
- Subscribe to RSS Feed
- Permalink
- Report Inappropriate Content
Can you please help me on this.
I'm receiving evt.native as 'undefined' while "CTRL + click" on the featurelayer here is my code,
/* eslint-disable */
import React, { useRef, useEffect } from 'react';
import MapView from '@arcgis/core/views/MapView';
import WebMap from '@arcgis/core/Map';
import FeatureLayer from '@arcgis/core/layers/FeatureLayer';
import Draw from '@arcgis/core/views/draw/Draw';
import Graphic from '@arcgis/core/Graphic';
import GraphicsLayer from '@arcgis/core/layers/GraphicsLayer';
import Point from '@arcgis/core/geometry/Point';
import MultiPoint from '@arcgis/core/geometry/Multipoint';
import Search from '@arcgis/core/widgets/Search'

import '../../assets/css/map.css';

const Map = () => {
  const mapDiv = useRef(null);
  const click_ref = useRef(null);

  useEffect(() => {
    if (mapDiv.current) {
      /**
       * Initialize application
       */
      const pntGraphics = new GraphicsLayer();

      let renderer = {
        type: 'simple', // autocasts as new SimpleRenderer()
        symbol: {
          type: 'simple-fill', // autocasts as new SimpleFillSymbol()
          color: [255, 255, 255, 0.5],
          style: 'none',
          outline: {
            // autocasts as new SimpleLineSymbol()
            color: 'white',
            width: 2,
          },
        },
      };

      let drawPnt,
        graphic,
        ctrlKey = false,
        highlight,
        statesLyrView;

      const webmap = new WebMap({
        basemap: 'streets-vector',
      });

      const view = new MapView({
        container: mapDiv.current,
        map: webmap,
        center: [-98.43750059604514, 38.1986442207947],
        scale: 25000000,
        ui: {
          components: ['zoom', 'compass'],
        },
      });

      const searchWidget = new Search({
        view: view
      });

      view.ui.add(searchWidget, "top-right");

      const stateFeatureLayer = new FeatureLayer({
        url:
          'https://services2.arcgis.com/JoecHEvChY6qFe2m/arcgis/rest/services/USA_States/FeatureServer/0',
        outFields: ['*'],
      });

      const cityFeatureLayer = new FeatureLayer({
        url:
          'https://sampleserver6.arcgisonline.com/arcgis/rest/services/USA/MapServer/0',
        outFields: ['*'],
      });

      webmap.addMany([stateFeatureLayer, cityFeatureLayer]);

      stateFeatureLayer.when(function () {
        view.whenLayerView(stateFeatureLayer).then(function (layerView) {
          statesLyrView = layerView;
        });
      });

      const draw = new Draw({
        view: view,
      });

      var sym = {
        type: 'simple-marker',
        style: 'circle',
        color: [0, 255, 255, 0.6],
        size: '8px',
        outline: {
          color: [0, 255, 255, 1],
          width: 1,
        },
      };

      view.ui.add('point-button', 'top-left');

      const drawPoint = () => {
        console.log('in ');
        if (highlight) {
          highlight.remove();
        }
        const action = draw.create('point');
        action.on('cursor-update', function (evt) {
          view.graphics.removeAll();
          drawPnt = new Point({
            x: evt.coordinates[0],
            y: evt.coordinates[1],
            spatialReference: view.spatialReference,
          });
          graphic = new Graphic({
            geometry: drawPnt,
            symbol: sym,
          });
          view.graphics.add(graphic);
          /*if (ctrlKey && !evt.native.ctrlKey) {
              draw.reset();
              view.graphics.removeAll();
              selectStates();
          }*/
        });
        action.on('draw-complete', function (evt) {
          if (evt.native.ctrlKey) {
            ctrlKey = true;
          } else {
            ctrlKey = false;
          }
          drawPnt = new Point({
            x: evt.coordinates[0],
            y: evt.coordinates[1],
            spatialReference: view.spatialReference,
          });
          graphic = new Graphic({
            geometry: drawPnt,
            symbol: sym,
          });
          pntGraphics.add(graphic);
          if (evt.native.ctrlKey) {
            drawPoint();
          } else {
            view.graphics.removeAll();
            selectStates();
          }
        });
        view.focus();
      }

      function selectStates() {
        console.log('in selectstate');
      }

      click_ref.current = drawPoint;
      //document.getElementById('point-button').onclick = drawPoint;
    }
  }, []);

  return (
    <div className="mapDiv" ref={mapDiv}>
      <button
        id="point-button"
        className="esri-widget esri-widget--button esri-interactive"
        title="Select Countries"
        onClick={()=>click_ref.current()}
      >
        <span className="esri-icon-map-pin"></span>
      </button>
    </div>
  );
};

export default Map;
I'm getting error at line:128 and 143, since evt.native showing as undefined.
I'm using
- Mark as New
- Bookmark
- Subscribe
- Mute
- Subscribe to RSS Feed
- Permalink
- Report Inappropriate Content
There is no event native (just as the error is telling you) on the 'draw-complete' event. You would have to figure out how to use the view click event if you want to capture the mouse click event.
- Mark as New
- Bookmark
- Subscribe
- Mute
- Subscribe to RSS Feed
- Permalink
- Report Inappropriate Content
Can you provide any idea regarding the multi-selection of the features by holding 'CTRL' and click in React-ESRI app.
Regards,
ValgenMap
- Mark as New
- Bookmark
- Subscribe
- Mute
- Subscribe to RSS Feed
- Permalink
- Report Inappropriate Content
@Valgenmap wrote:Can you please help me on this.
I'm receiving evt.native as 'undefined' while "CTRL + click" with cps test on the featurelayer here is my code,
/* eslint-disable */
import React, { useRef, useEffect } from 'react';
import MapView from '@arcgis/core/views/MapView';
import WebMap from '@arcgis/core/Map';
import FeatureLayer from '@arcgis/core/layers/FeatureLayer';
import Draw from '@arcgis/core/views/draw/Draw';
import Graphic from '@arcgis/core/Graphic';
import GraphicsLayer from '@arcgis/core/layers/GraphicsLayer';
import Point from '@arcgis/core/geometry/Point';
import MultiPoint from '@arcgis/core/geometry/Multipoint';
import Search from '@arcgis/core/widgets/Search'

import '../../assets/css/map.css';

const Map = () => {
  const mapDiv = useRef(null);
  const click_ref = useRef(null);

  useEffect(() => {
    if (mapDiv.current) {
      /**
       * Initialize application
       */
      const pntGraphics = new GraphicsLayer();

      let renderer = {
        type: 'simple', // autocasts as new SimpleRenderer()
        symbol: {
          type: 'simple-fill', // autocasts as new SimpleFillSymbol()
          color: [255, 255, 255, 0.5],
          style: 'none',
          outline: {
            // autocasts as new SimpleLineSymbol()
            color: 'white',
            width: 2,
          },
        },
      };

      let drawPnt,
        graphic,
        ctrlKey = false,
        highlight,
        statesLyrView;

      const webmap = new WebMap({
        basemap: 'streets-vector',
      });

      const view = new MapView({
        container: mapDiv.current,
        map: webmap,
        center: [-98.43750059604514, 38.1986442207947],
        scale: 25000000,
        ui: {
          components: ['zoom', 'compass'],
        },
      });

      const searchWidget = new Search({
        view: view
      });

      view.ui.add(searchWidget, "top-right");

      const stateFeatureLayer = new FeatureLayer({
        url:
          'https://services2.arcgis.com/JoecHEvChY6qFe2m/arcgis/rest/services/USA_States/FeatureServer/0',
        outFields: ['*'],
      });

      const cityFeatureLayer = new FeatureLayer({
        url:
          'https://sampleserver6.arcgisonline.com/arcgis/rest/services/USA/MapServer/0',
        outFields: ['*'],
      });

      webmap.addMany([stateFeatureLayer, cityFeatureLayer]);

      stateFeatureLayer.when(function () {
        view.whenLayerView(stateFeatureLayer).then(function (layerView) {
          statesLyrView = layerView;
        });
      });

      const draw = new Draw({
        view: view,
      });

      var sym = {
        type: 'simple-marker',
        style: 'circle',
        color: [0, 255, 255, 0.6],
        size: '8px',
        outline: {
          color: [0, 255, 255, 1],
          width: 1,
        },
      };

      view.ui.add('point-button', 'top-left');

      const drawPoint = () => {
        console.log('in ');
        if (highlight) {
          highlight.remove();
        }
        const action = draw.create('point');
        action.on('cursor-update', function (evt) {
          view.graphics.removeAll();
          drawPnt = new Point({
            x: evt.coordinates[0],
            y: evt.coordinates[1],
            spatialReference: view.spatialReference,
          });
          graphic = new Graphic({
            geometry: drawPnt,
            symbol: sym,
          });
          view.graphics.add(graphic);
          /*if (ctrlKey && !evt.native.ctrlKey) {
              draw.reset();
              view.graphics.removeAll();
              selectStates();
          }*/
        });
        action.on('draw-complete', function (evt) {
          if (evt.native.ctrlKey) {
            ctrlKey = true;
          } else {
            ctrlKey = false;
          }
          drawPnt = new Point({
            x: evt.coordinates[0],
            y: evt.coordinates[1],
            spatialReference: view.spatialReference,
          });
          graphic = new Graphic({
            geometry: drawPnt,
            symbol: sym,
          });
          pntGraphics.add(graphic);
          if (evt.native.ctrlKey) {
            drawPoint();
          } else {
            view.graphics.removeAll();
            selectStates();
          }
        });
        view.focus();
      }

      function selectStates() {
        console.log('in selectstate');
      }

      click_ref.current = drawPoint;
      //document.getElementById('point-button').onclick = drawPoint;
    }
  }, []);

  return (
    <div className="mapDiv" ref={mapDiv}>
      <button
        id="point-button"
        className="esri-widget esri-widget--button esri-interactive"
        title="Select Countries"
        onClick={()=>click_ref.current()}
      >
        <span className="esri-icon-map-pin"></span>
      </button>
    </div>
  );
};

export default Map;
I'm getting error at line:128 and 143, since evt.native showing as undefined.
I'm using
Is this code snippet working for anyone? I am not able to get it to run at all. A little noob here, please help.
- Mark as New
- Bookmark
- Subscribe
- Mute
- Subscribe to RSS Feed
- Permalink
- Report Inappropriate Content
In 4.13 the draw action had a native property. I am not sure when it was removed but now in 4.23 there is no native property returned in the DrawAction. I mentioned this above to vlagebmap back on 06-25-2021.
This is what it would look like in 4.23 (vanilla JS)
<!DOCTYPE html>
<html>

<head>
  <meta charset="utf-8" />
  <meta name="viewport" content="initial-scale=1,maximum-scale=1,user-scalable=no" />
  <title>Select by Point</title>

  <link rel="stylesheet" href="https://js.arcgis.com/4.23/esri/themes/light/main.css" />
  <script src="https://js.arcgis.com/4.23/"></script>

  <style>
    html,
    body,
    #viewDiv {
      padding: 0;
      margin: 0;
      height: 100%;
      width: 100%;
    }
  </style>
  <script>
    require([
      "esri/views/draw/Draw",
      "esri/Map",
      "esri/Graphic",
      "esri/layers/GraphicsLayer",
      "esri/layers/FeatureLayer",
      "esri/geometry/Point",
      "esri/geometry/Multipoint",
      "esri/views/MapView"
    ], function (Draw, Map, Graphic, GraphicsLayer, FeatureLayer, Point, Multipoint, MapView) {
      const pntGraphics = new GraphicsLayer();
      let viewClickEvtHandler = null, viewMouseMoveEvtHandler = null;
      var renderer = {
          type: "simple", // autocasts as new SimpleRenderer()
          symbol: {
            type: "simple-fill", // autocasts as new SimpleFillSymbol()
            color: [255, 255, 255, 0.5],
            style: "none",
            outline: {  // autocasts as new SimpleLineSymbol()
              color: "white",
              width: 2
            }
          }
        };
      const statesLyr = new FeatureLayer({
        url: 'https://sampleserver6.arcgisonline.com/arcgis/rest/services/USA/MapServer/2',
        renderer: renderer,
        outFields: ['*']
      });

      const cityFeatureLayer = new FeatureLayer({
        url: 'https://sampleserver6.arcgisonline.com/arcgis/rest/services/USA/MapServer/0',
        outFields: ['*'],
      });

      let drawPnt, graphic, ctrlKey = false, moveCtrlKey = false, highlight, statesLyrView;

      const map = new Map({
        basemap: 'streets-vector',
        layers: [pntGraphics, statesLyr, cityFeatureLayer]
      });

      const view = new MapView({
        container: "viewDiv",
        map: map,
        center: [-98.43750059604514, 38.1986442207947],
        scale: 25000000,
        ui: {
          components: ['zoom', 'compass'],
        }
      });

      statesLyr.when(function(){
        view.whenLayerView(statesLyr).then(function(layerView) {
          statesLyrView = layerView;
        });
      })

      const draw = new Draw({
        view: view
      });

      var sym = {
        type: "simple-marker",
        style: "circle",
        color: [0, 255, 255, 0.6],
        size: "8px",
        outline: {
          color: [0, 255, 255, 1],
          width: 1
        }
      };

      view.ui.add("point-button", "top-left");

      document.getElementById("point-button").onclick = drawPoint;

      function drawPoint() {
        if(viewMouseMoveEvtHandler){
          viewMouseMoveEvtHandler.remove()
          viewMouseMoveEvtHandler = null
        }
        if(viewClickEvtHandler){
          viewClickEvtHandler.remove()
          viewClickEvtHandler = null
        }
        const action = draw.create("point");
        viewMouseMoveEvtHandler = view.on('pointer-move', (evt) => {
          if (evt.native.ctrlKey) {
            moveCtrlKey = true;
          }else{
            moveCtrlKey = false;
          }
        })
        viewClickEvtHandler = view.on('pointer-down', (evt)=>{
          if (evt.native.ctrlKey) {
            ctrlKey = true;
          }else{
            ctrlKey = false;
          }
        })
        if (highlight) {
          highlight.remove();
        }

        // Give a visual feedback to users as they move the pointer over the view
        action.on("cursor-update", function (evt) {
          view.graphics.removeAll();
          drawPnt = new Point({
            x: evt.coordinates[0],
            y: evt.coordinates[1],
            spatialReference: view.spatialReference
          });
          graphic = new Graphic({
            geometry: drawPnt,
            symbol: sym
          });
          view.graphics.add(graphic);
          if(ctrlKey && !moveCtrlKey){
            draw.reset();
            view.graphics.removeAll();
            selectStates();
          }
        });

        action.on("draw-complete", function (evt) {
          drawPnt = new Point({
            x: evt.coordinates[0],
            y: evt.coordinates[1],
            spatialReference: view.spatialReference
          });

          graphic = new Graphic({
            geometry: drawPnt,
            symbol: sym
          });
          pntGraphics.add(graphic);
          if (ctrlKey) {
            drawPoint();
          } else {
            view.graphics.removeAll();
            selectStates();
          }
        });
        view.focus();
      };

      function selectStates(){
        ctrlKey = false
        moveCtrlKey = false
        if(viewMouseMoveEvtHandler){
          viewMouseMoveEvtHandler.remove()
          viewMouseMoveEvtHandler = null
        }
        if(viewClickEvtHandler){
          viewClickEvtHandler.remove()
          viewClickEvtHandler = null
        }
        let mp = new Multipoint({
          spatialReference: view.spatialReference
        });
        let pntArray = pntGraphics.graphics.map(function(gra){
          mp.addPoint(gra.geometry);
        });

        const query = {
          geometry: mp,
          outFields: ["*"],
          outSpatialReference: view.spatialReference,
          returnGeometry: true
        };
        statesLyr.queryFeatures(query)
        .then(function(results){
          const graphics = results.features;
          // remove existing highlighted features
          if (highlight) {
            highlight.remove();
          }

          // highlight query results
          highlight = statesLyrView.highlight(graphics);
          pntGraphics.removeAll();
        }).catch(function(err){
          console.error(err);
        })
      }
    });
  </script>
</head>

<body>
  <div id="viewDiv">
    <div id="point-button" class="esri-widget esri-widget--button esri-interactive" title="Select Countries">
      <span class="esri-icon-map-pin"></span>
    </div>
  </div>

</body>

</html>