- Home
- :
- All Communities
- :
- Developers
- :
- JavaScript Maps SDK
- :
- JavaScript Maps SDK Questions
- :
- Re: Create spheres at right location under the sur...
- Subscribe to RSS Feed
- Mark Topic as New
- Mark Topic as Read
- Float this Topic for Current User
- Bookmark
- Subscribe
- Mute
- Printer Friendly Page
Create spheres at right location under the surface
- Mark as New
- Bookmark
- Subscribe
- Mute
- Subscribe to RSS Feed
- Permalink
- Report Inappropriate Content
Hello,
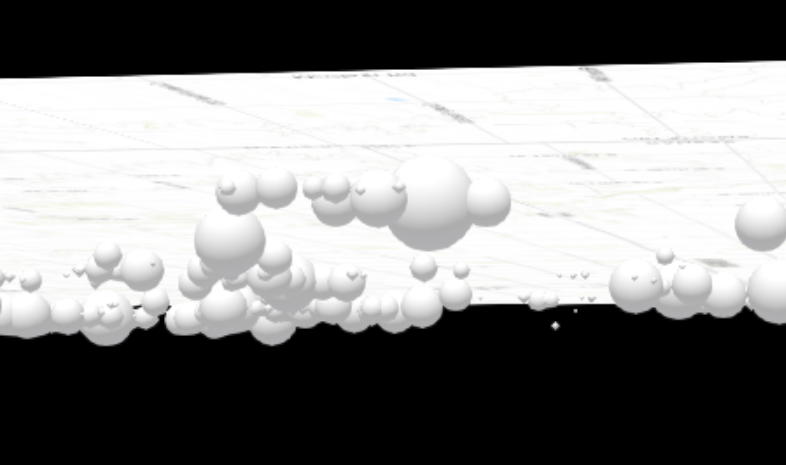
I have been trying to build something very similar to this WebMap https://developers.arcgis.com/javascript/latest/sample-code/sandbox/index.html?sample=scene-local using my own data, I have gotten most of it to work for myself except extruding my points to the right location.. Here is what my code is producing;

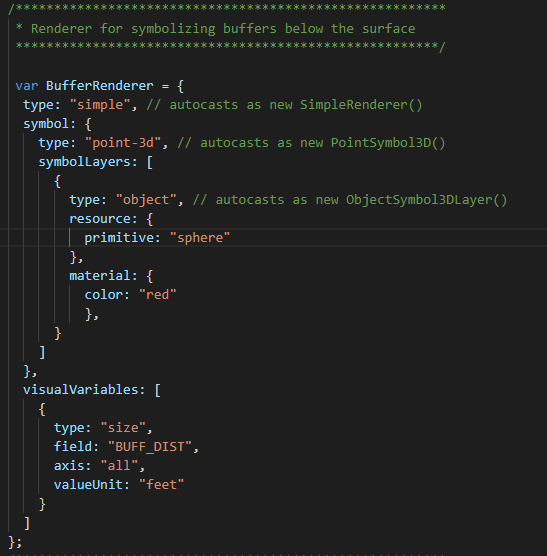
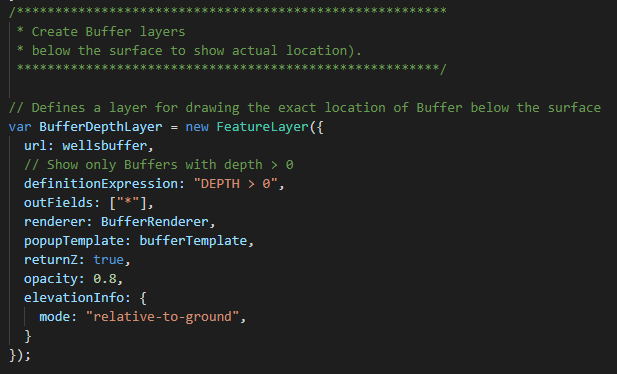
The points are sort of half n half on the surface and below, where I would like them to be displayed is right at the bottom of the well.I cant use a general offset because all the bottom of the wells are different depths, if there is a way I could offset the points by grabbing the value in that depth column that would work, but I am still new to this JavaScript API. I have pretty much used the same code as the one in that scene just with different parameters. here is the code;
Thank you for any help!
Solved! Go to Solution.
Accepted Solutions
- Mark as New
- Bookmark
- Subscribe
- Mute
- Subscribe to RSS Feed
- Permalink
- Report Inappropriate Content
Hi Adam
Do your data have z-values?
If not you can set the elevation with an Arcade Expression see the help FeatureLayer-elevationInfo. Or see in the chapter "Feature Z" in arcade guide.
With the following codesnippet you can see the 3d-points below the ground with -1000 meters:
elevationInfo: {
mode: "relative-to-ground",
featureExpressionInfo: {
expression: "-1000"
}
},
full sample:
<!DOCTYPE html>
<html>
<head>
<meta charset="utf-8" />
<meta
name="viewport"
content="initial-scale=1,maximum-scale=1,user-scalable=no"
/>
<title>Create a local scene - 4.11</title>
<style>
html,
body,
#viewDiv {
padding: 0;
margin: 0;
height: 100%;
width: 100%;
}
#homeDiv {
left: 15px;
top: 130px;
z-index: 35;
position: absolute;
}
</style>
<link
rel="stylesheet"
href="https://js.arcgis.com/4.11/esri/themes/light/main.css"
/>
<script src="https://js.arcgis.com/4.11/"></script>
<script>
require([
"esri/Map",
"esri/views/SceneView",
"esri/layers/FeatureLayer",
"esri/widgets/Home"
], function(Map, SceneView, FeatureLayer, Home) {
var quakesUrl =
"https://services.arcgis.com/V6ZHFr6zdgNZuVG0/arcgis/rest/services/ks_earthquakes_since_2000/FeatureServer/0";
// The clipping extent for the scene
var kansasExtent = {
// autocasts as new Extent()
xmax: -10834217,
xmin: -10932882,
ymax: 4493918,
ymin: 4432667,
spatialReference: {
// autocasts as new SpatialReference()
wkid: 3857
}
};
var quakesRenderer = {
type: "simple", // autocasts as new SimpleRenderer()
symbol: {
type: "point-3d", // autocasts as new PointSymbol3D()
symbolLayers: [
{
type: "object", // autocasts as new ObjectSymbol3DLayer()
resource: {
primitive: "sphere"
}
}
]
},
visualVariables: [
{
type: "size",
field: "mag",
axis: "all",
stops: [
{
value: 2,
size: 100
},
{
value: 5,
size: 2000
}
]
}
]
};
// Defines a layer for drawing the exact location of quakes below the surface
var quakesDepthLayer = new FeatureLayer({
url: quakesUrl,
// Show only quakes of magnitude 2.0 or higher
definitionExpression: "mag >= 2",
outFields: ["*"],
renderer: quakesRenderer,
returnZ: false,
elevationInfo: {
mode: "relative-to-ground",
featureExpressionInfo: {
expression: "-1000"
}
},
});
var map = new Map({
basemap: "topo",
layers: [
quakesDepthLayer
],
ground: {
navigationConstraint: {
type: "none"
}
}
});
var view = new SceneView({
container: "viewDiv",
map: map,
// Indicates to create a local scene
viewingMode: "local",
// Use the exent defined in clippingArea to define the bounds of the scene
clippingArea: kansasExtent,
extent: kansasExtent,
// Turns off atmosphere and stars settings
environment: {
atmosphere: null,
starsEnabled: false
}
});
});
</script>
</head>
<body>
<div id="viewDiv"></div>
</body>
</html>
- Mark as New
- Bookmark
- Subscribe
- Mute
- Subscribe to RSS Feed
- Permalink
- Report Inappropriate Content
Hey Sascha,
Thanks for the reply! That was exactly it with the "HasZ" property on my shapefile, bit of a silly mistake but when I displayed the points through arcmap in "Add XY Data" I had forget to include that z field, all is working well now 
I just have a problem with authorization now, I have created a thread for this also https://community.esri.com/thread/234792-authentication-of-agol-layers-from-webmap
should you have the time to take a look into the issue that would be greatly appreciated!
Thank you