- Home
- :
- All Communities
- :
- Developers
- :
- JavaScript Maps SDK
- :
- JavaScript Maps SDK Questions
- :
- Re: 4.17 Memory Issue - Angular
- Subscribe to RSS Feed
- Mark Topic as New
- Mark Topic as Read
- Float this Topic for Current User
- Bookmark
- Subscribe
- Mute
- Printer Friendly Page
4.17 Memory Issue - Angular
- Mark as New
- Bookmark
- Subscribe
- Mute
- Subscribe to RSS Feed
- Permalink
- Report Inappropriate Content
Good Day
I'm trying out 4.17 with the following test repo: GitHub - docmur/angular-esri-memory-test, I added in the new view.destroy and map.destroy but the memory is still not getting freed!
Have I taken the correct steps to free the memory?
Thanks
- Mark as New
- Bookmark
- Subscribe
- Mute
- Subscribe to RSS Feed
- Permalink
- Report Inappropriate Content
Hi Andrew, just confirming, is this issue continuation of your previous issue? At 4.17 there is a known issue with view.destroy() not fully releasing memory. Sorry about that, we've tentatively scheduled a fix for 4.18 in December.
Your code looks correct, just one small note that when you call view.destroy() you shouldn't need to call map.destroy().
With that said, if Angular attaches any references to the MapView.container that could also cause items to be retained in memory and the ArcGIS JS API has no control over that. Once we have a fix in place for view.destroy() it will be much easier to test for Angular related issues.
- Mark as New
- Bookmark
- Subscribe
- Mute
- Subscribe to RSS Feed
- Permalink
- Report Inappropriate Content
Hey
This would be a continuation, but to prevent from it getting bunched together I made this a new task. To be fair the only change on this test repo is that I changed the version to 4.17 from next. If we need to wait until December that's fine.
We'll wait for a fix, I just wanted to make sure this was known, feel free to use that code I posted for testing.
Thanks
- Mark as New
- Bookmark
- Subscribe
- Mute
- Subscribe to RSS Feed
- Permalink
- Report Inappropriate Content
Hey Andrew, we did a bit more testing in a stand-alone, non-Angular test app and the 4.17 view.destroy() code appears to be working as expected, a few things to know:
- At 4.17, there will still be some items cached in memory after you call destroy(). For the MapView to be memory efficient it reuses the same instances of certain arrays and other objects. They are created once and reused.
- The important thing is that memory usage does not increase after the first MapView is created.
- If your user workflows call for a lot of back and forth between map-related pages and non-map-related routes, we still recommend recycling MapViews rather than destroying them. I think I may have mentioned it in the previous issue, some customers with complex workflows have built a pool of MapViews in an array that lets a limited number of views be recycled.
A few things for you to try before you retest:
- Remove both references to the JS API in your index.html. Esri-loader will take care of lazy loading the JS API when you call loadModules().
- Add esri-loader to your package.json file as shown here using some variation of npm install esri-loader@latest.
- Remove this line from your package.json: https://github.com/docmur/angular-esri-memory-test/blob/master/frontend/package.json#L39 and delete esri-module-loader from node_modules. This is to make sure you only have one instance of esri-loader in memory.
- Mark as New
- Bookmark
- Subscribe
- Mute
- Subscribe to RSS Feed
- Permalink
- Report Inappropriate Content
Good Day
Sorry for the delay in reply, I integrated your suggestions and added a much bigger data file. This code is roughly laid out to match our production code:
esri-printtask-issue/src/app at master · docmur/esri-printtask-issue · GitHub
I'm still seeing the memory climb when I switch back and forth, is there anything else you can recommend?
Thanks
- Mark as New
- Bookmark
- Subscribe
- Mute
- Subscribe to RSS Feed
- Permalink
- Report Inappropriate Content
Hey Andrew, how are you measuring memory usage?
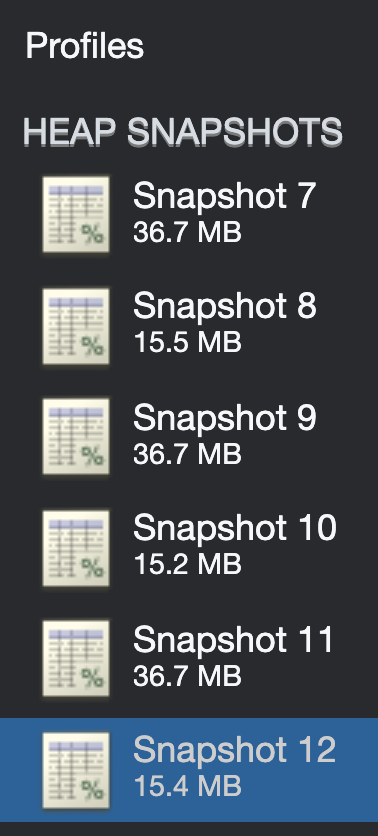
When I use Chrome's "Take Snapshot" I'm not seeing any memory leaks. Here's the workflow I'm using:
1. Load app - take snapshot
2. Open map - take snapshot (pan/zoom around a bit)
3. Close map - take snapshot
4. Repeat steps 2 & 3
Using your repo, I followed this pattern through 12 iterations and everything looks good. You can see the size of the sequential heap snapshots in this screen capture stay fairly consistent in size:
- Mark as New
- Bookmark
- Subscribe
- Mute
- Subscribe to RSS Feed
- Permalink
- Report Inappropriate Content
Good Day
My apologizes, I was exceedingly unclear. When I mentioned I saw the memory climb, I was talking about the system monitor on my OS, the first screenshots are taken using the development repo, then I switched to our production version to get a much bigger network loaded.
The first picture is sitting on the dashboard before loading a map: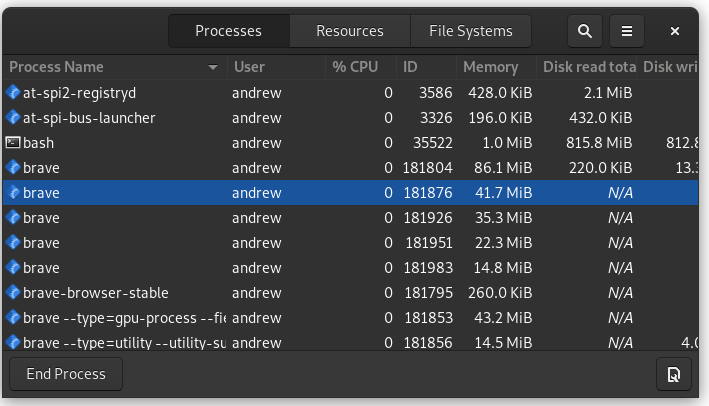
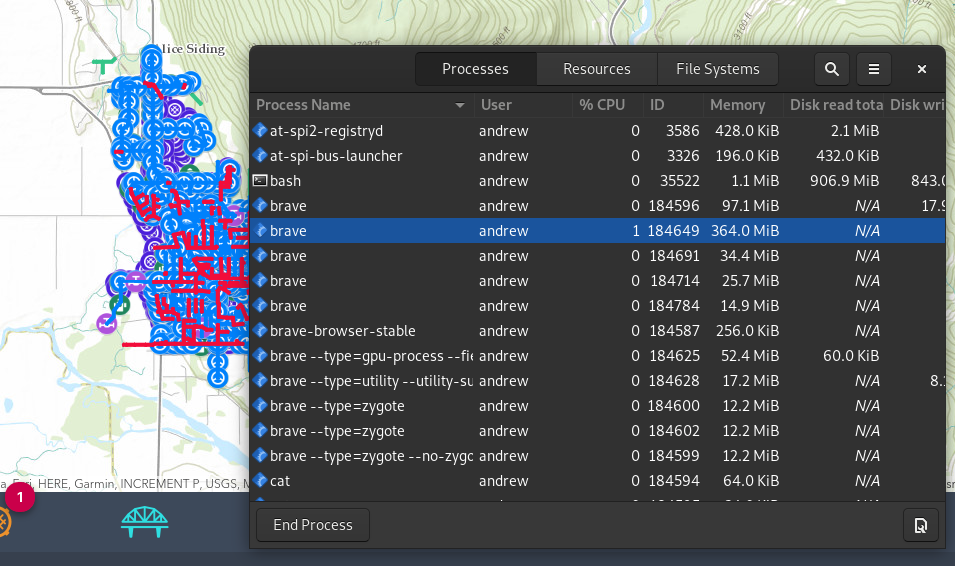
After loading 1 map and going back to the dashboard;

After cycling that 5 more times, so I've loaded the map 6 times, and I'm back at the dashboard, this is after forced garbage collection:

Specifically I'm referencing Brave, although I'll see the same activity from any Chromium based browser. Oddly enough Firefox is stable and doesn't throw the memory around, When I view the heap through the memory tab in the console, that's staying stable, it's the system memory that seems to be all over the board.
If I run this same kind of test on our production version using the following network, which is 7000+ segments 45 Feature Layers, 10 of them having meaningful data :
Then I cycle through ~20 maps, and land back at the dashboard, after a forced garbage collection I'm setting at:

To be fair, this is much better then it was in 4.16, where that number would commonly go over 2 GiB+, but it seems something is still kicking around. I've been sitting at the Dashboard for ~10+ minutes and that number is fairly stable.
Thanks
- Mark as New
- Bookmark
- Subscribe
- Mute
- Subscribe to RSS Feed
- Permalink
- Report Inappropriate Content
Thanks for clarifying. Based on your additional info it sounds like things are working correctly in the JS API. And, we'll continue to make improvements. Just looking at total system memory usage of an app, it's impossible to see what's really going on. For example, even the browsers themselves can leak memory.
The definitive way to test if the JS API is leaking memory is to run it in a stand-alone app.
- Mark as New
- Bookmark
- Subscribe
- Mute
- Subscribe to RSS Feed
- Permalink
- Report Inappropriate Content
Fair enough
If the test code looks fine, then there's no reason to assume our production code would have any issue, as the test code is just a simplified version. I'll admit it's not idea to look at system memory, but I think it can be helpful, but as you pointed out that opens up many, many more possible memory issues.
Best thing we can do is a long run test and see how it operates / handles over the next couple weeks.
Thanks for you help 