- Home
- :
- All Communities
- :
- Products
- :
- 3D
- :
- 3D Questions
- :
- Re: vertical exaggeration
- Subscribe to RSS Feed
- Mark Topic as New
- Mark Topic as Read
- Float this Topic for Current User
- Bookmark
- Subscribe
- Mute
- Printer Friendly Page
vertical exaggeration
- Mark as New
- Bookmark
- Subscribe
- Mute
- Subscribe to RSS Feed
- Permalink
- Report Inappropriate Content
Hi,
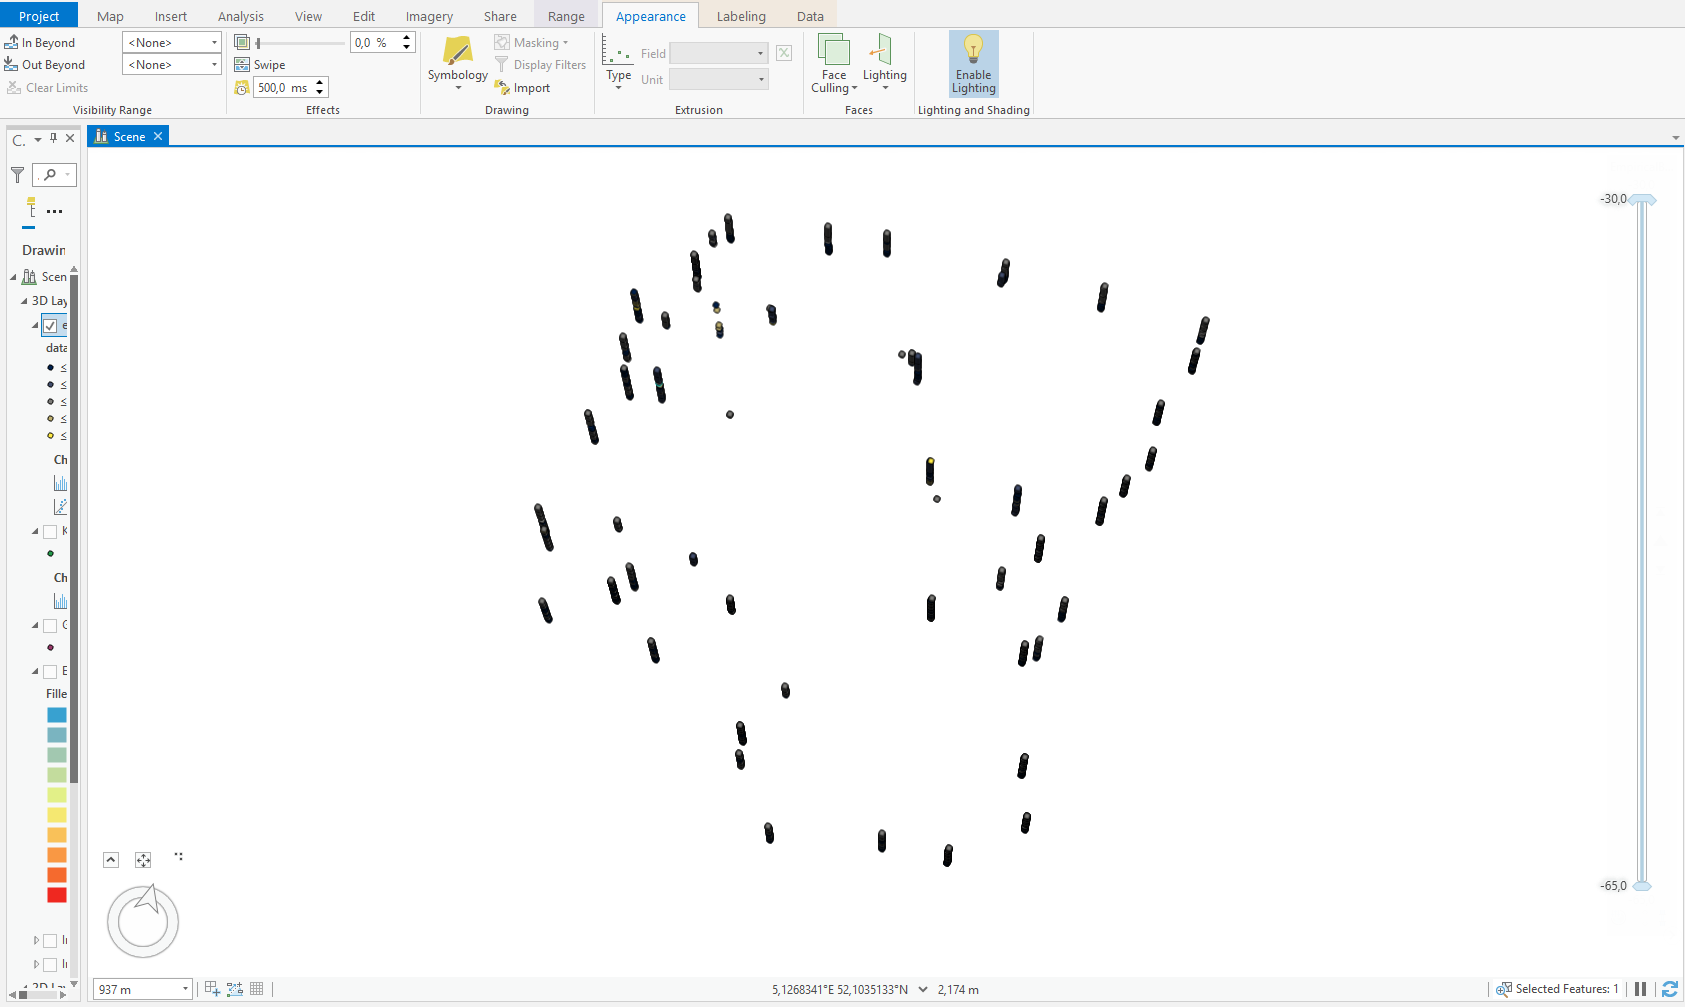
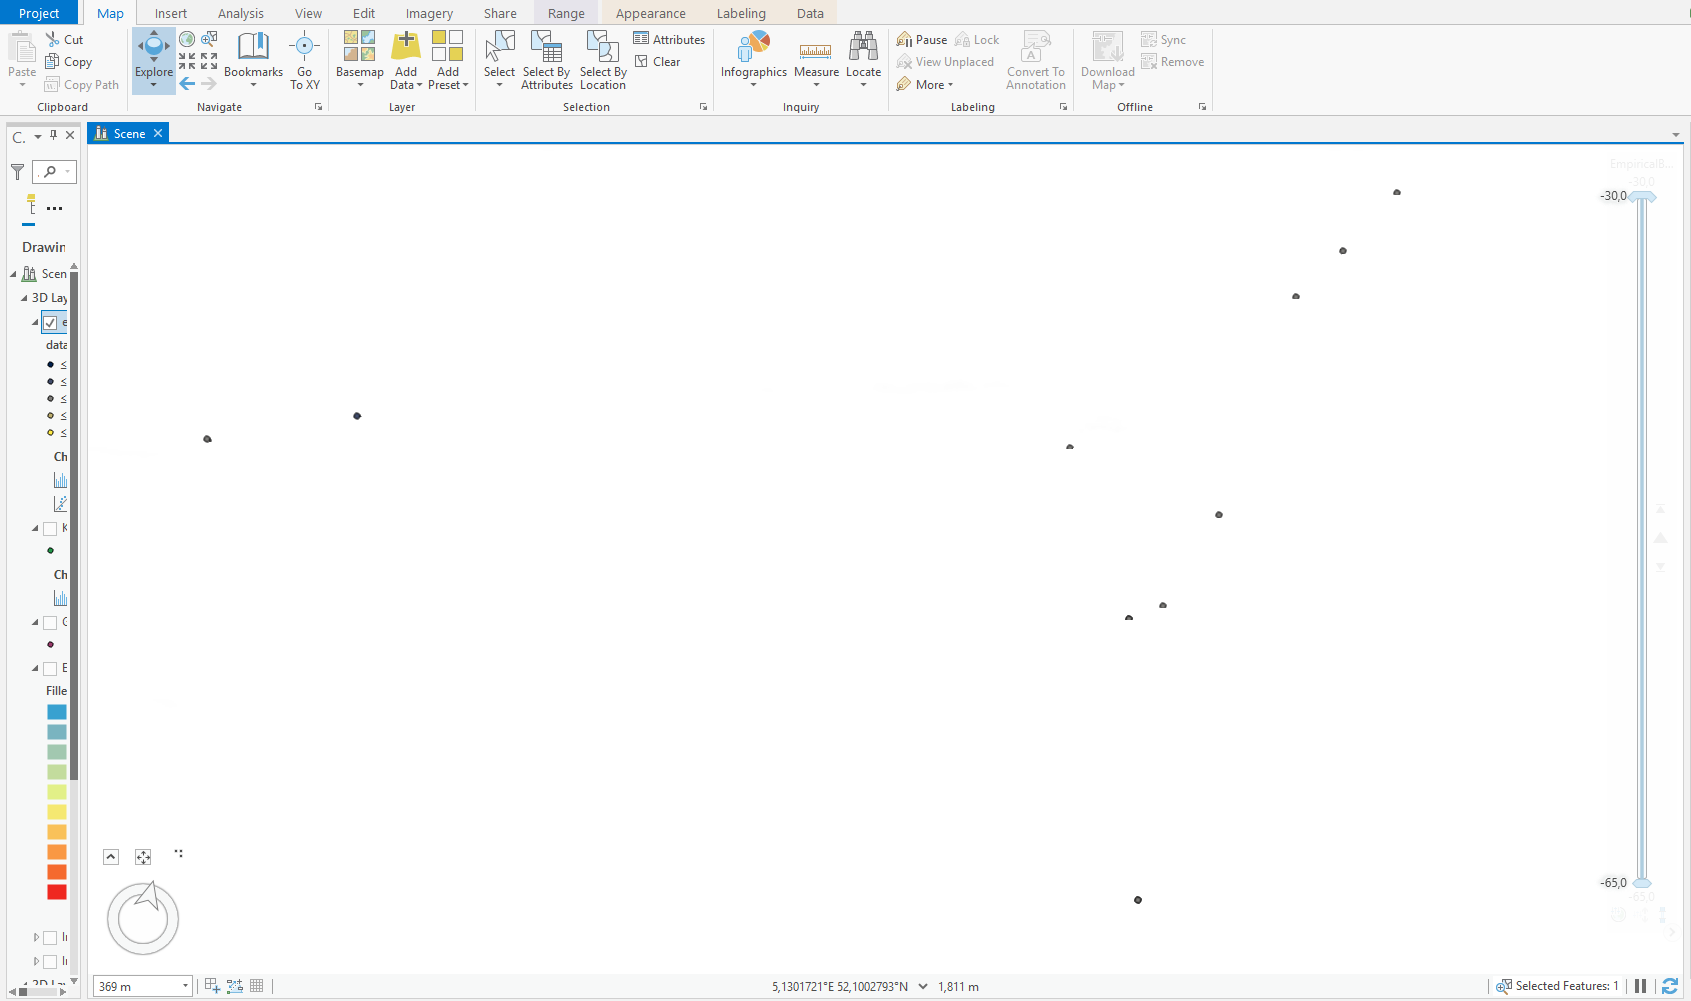
I have a set of 3d point data (hydraulic conductivity according to performed drillings). I want to use this dataset for geostatistical interpolation. To be able to start with an investigation of my dataset I coloured the values with a gradient. I see my data as below. The datapoints are too close together in the vertical direction to be able to study them. When I zoom in by scrolling the mouse, the dots disappear from view (see bottom picture). With the sliding bar on the right I can't seem to do anything for the view.
I thought I use a vertical exaggeration, but I don't see how (there is no option for it under the appearance tab).
Does anyone have an idea how to solve this?
Thanks, Suzanne
- Mark as New
- Bookmark
- Subscribe
- Mute
- Subscribe to RSS Feed
- Permalink
- Report Inappropriate Content
Hi again,
I have a lot to say but unfortunately not a lot of time right now. I'm going to try to cover the most important things, sorry for quickly jumping between topics.
The GA Layer 3D To NetCDF tool is used to make the source file for the Voxel layer. This tool and the voxel layer itself are both new in ArcGIS Pro 2.6, which has only been available for a few months. If you aren't seeing the option to add a voxel layer in Add Data in a scene view, you probably don't have the most recent version.
If you have ArcGIS Pro 2.5, you can use the GA Layer 3D To Multidimensional Raster tool to export the EBK3D layers directly to a multidimensional CRF raster.
I see in your image of cross-validation that many of the points have identical (or very close to identical) values. These are the horizontal lines of red points in the graph. Repeated values can be problematic for the Empirical transformation, especially with large gaps between the repeated values (this can be seen in the histogram). The empirical transformation is essentially trying to fit a smooth curve to the histogram, then uses this curve as a reference to the normal distribution. However, if the histogram isn't smooth, the curve won't fit the histogram well, and it will likely give strange results in the gaps between the peaks in the histogram.
Regarding multivariate normality for the quantile output, this is very hard to explain without giving a 2 hour statistics lecture, so I'll try to keep it short. Kriging of all types is designed to directly predict the mean and standard error of the true value at a new location. However, you need a full distribution to estimate quantiles, and the mean and the standard error are not enough to fully reconstruct a distribution. I could show you many different datasets that all have the same mean and standard error, but they would all have very different quantile values. So, to calculate quantiles, you have to make an assumption about the predictive distribution, which is almost always a normality assumption. The reason for this is that if your input data are normally distributed (or transformed to be normal), then the kriging predictions will also be normally distributed. This is why you check for normality in your input data first so that you don't have to worry about it later.
In practice, you do the best that you can to transform the data to be closer to normal, but that is going to be difficult to do for a histogram with repeated values and gaps. If it were me, I would probably try different EBK3D parameters like subset size and overlap factor and hope that you land on a particular subsetting where the model is most stable. I would also experiment with not using a transformation at all.
To judge how well a particular model is working, I would focus on cross-validation, specifically the RMSE and the Inside 90/95 Percent Interval. The RMSE is approximately equal to the average difference between the true and predicted value, so it's a quick test to see if a model is too inaccurate to be viable. The two Inside 90/95 statistics build confidence intervals using the normality assumption. If the values aren't too far off from 90 and 95, it may be safe to assume normality to estimate quantiles.
-Eric
- Mark as New
- Bookmark
- Subscribe
- Mute
- Subscribe to RSS Feed
- Permalink
- Report Inappropriate Content
The only piece to add to this guidance is directions for activating the Voxel Exploration pane and creating Isosurfaces: Create a voxel layer isosurface—ArcGIS Pro | Documentation
- Mark as New
- Bookmark
- Subscribe
- Mute
- Subscribe to RSS Feed
- Permalink
- Report Inappropriate Content
Hi again Eric and Phil,
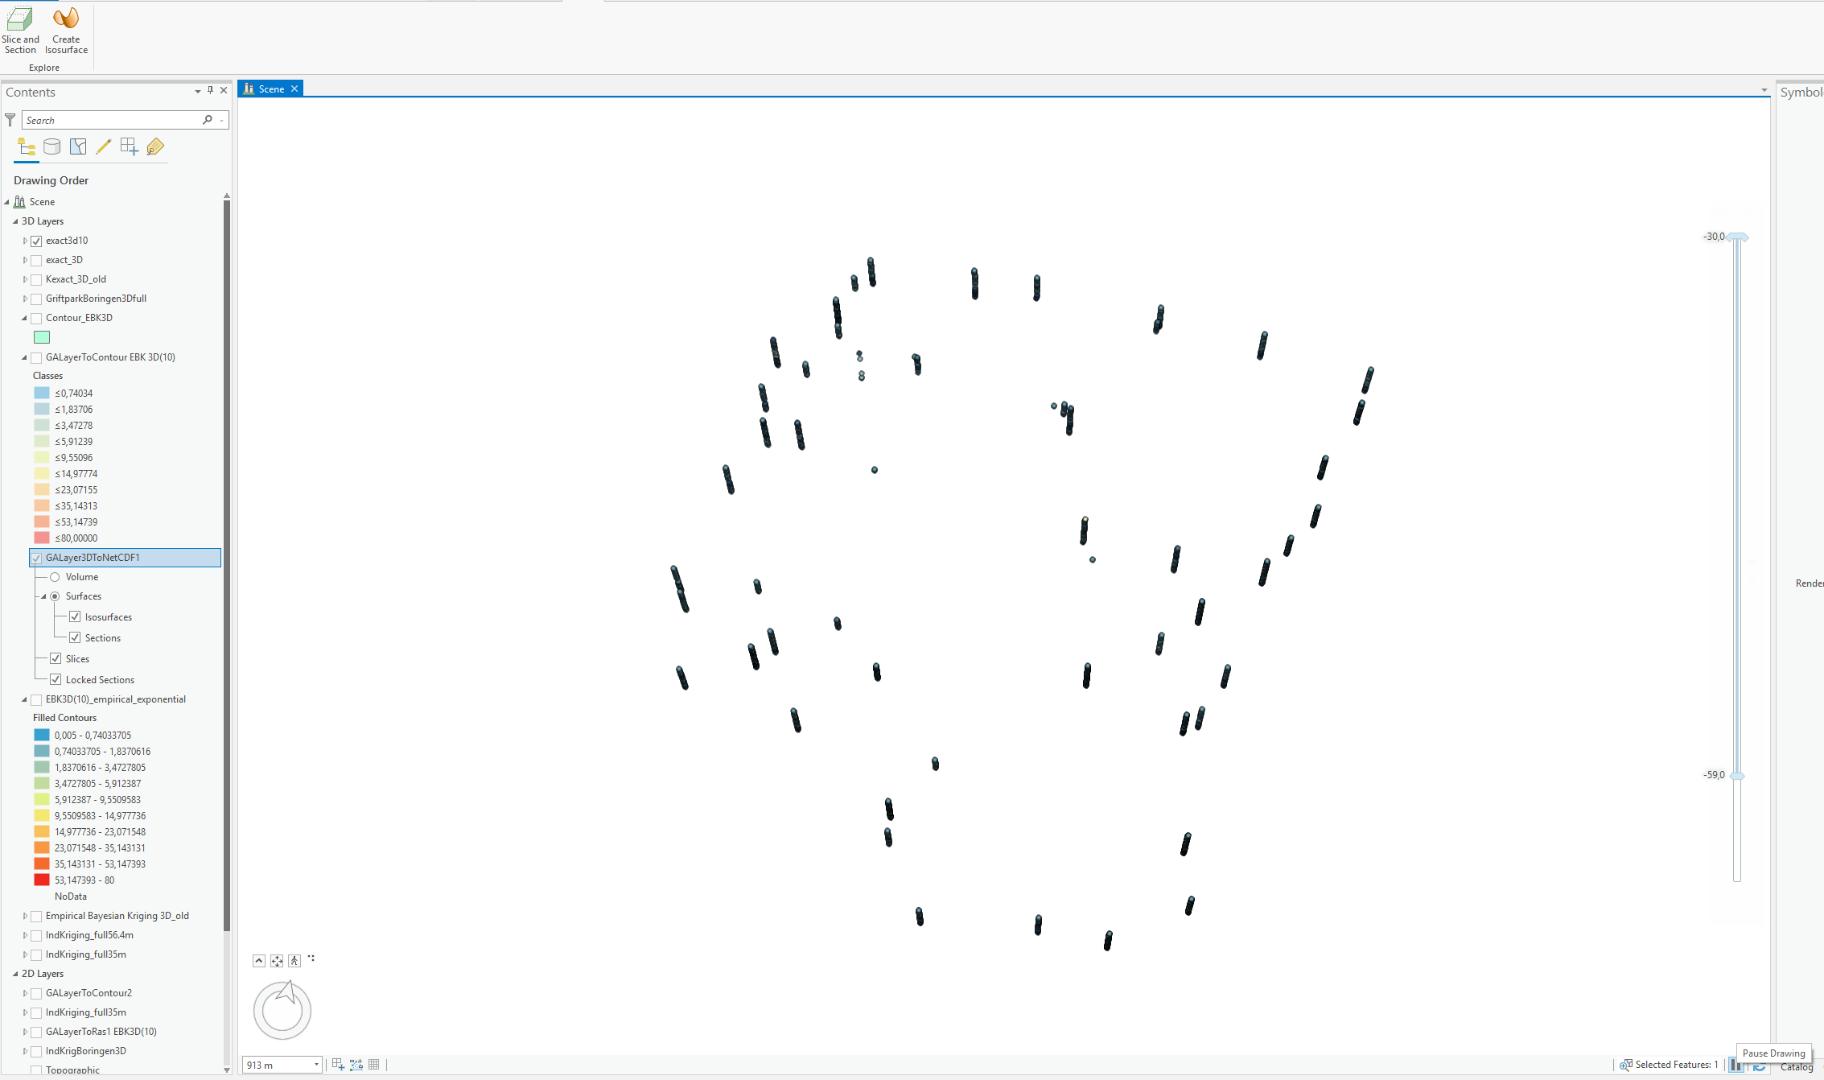
regarding the voxel experience: indeed I needed to download the latest version of 2.6! I created the NetCDF file using the GA Layer 3D to NetCDF tool. I then added the voxel layer. However, when I then want to create the isosurface, nothing happens.. I think that it is trying to create the layer (at least I can 'pause the drawing' see pic) but doesnt get there.. I get no error messages or so. Any ideas what goes wrong?
Regarding Eric's comment about the cross validation: Indeed the data that I put in is very course. Most data points have the 'value': 'medium grained sand'. Then there are a few locations with course sand and some with clay. The bulk of course grained sand I have given a hydraulic conductivity of 15m/d, but of course in reality these values might locally vary between say 5 and 25m/d. I will play around with the other EBK3D parameters as you suggest and also add a measurement error column in my input file and see what that does for my results.
Cheers, Suzanne
- Mark as New
- Bookmark
- Subscribe
- Mute
- Subscribe to RSS Feed
- Permalink
- Report Inappropriate Content
Hi Suzanne,
The isosurface is a 3D contour, so you have to specify which value you want to contour. My guess is that the default value is producing a very small (or even empty) isosurface. You can change the isosurface value in the Voxel Exploration pane.
I recently wrote a LearnGIS lesson that performs EBK3D and ends with voxel visualization and exploration. You might find the entire thing useful, but here's the section specifically about creating isosurfaces:
Interpolate 3D oxygen measurements in Monterey Bay | Learn ArcGIS
-Eric
- Mark as New
- Bookmark
- Subscribe
- Mute
- Subscribe to RSS Feed
- Permalink
- Report Inappropriate Content
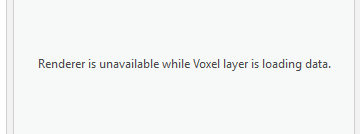
Hi Eric,
I am not sure that is the problem, if I try for example to change the symbology, I get this message:

I wonder if that might also be the reason I cannot find the voxel exploration pane at all...
Suzanne
- Mark as New
- Bookmark
- Subscribe
- Mute
- Subscribe to RSS Feed
- Permalink
- Report Inappropriate Content
Dear Eric (and Phil),
I have tried again to get the isosurface, but I do not manage. I follow the steps exactly as indicated in the lesson you sent me.
I created the .nc file, but when I want to add the multi-dimensional raster layer I get the following warning:

Despite this warning, it does create this menu for me
but it doesnt show me anything and tells me
I also tried right clicking on the Surfaces box and say 'create isosurface' but it doesnt do anything.
Any idea what might be going wrong?
Thanks...!
Kind regards,
Suzanne
- Mark as New
- Bookmark
- Subscribe
- Mute
- Subscribe to RSS Feed
- Permalink
- Report Inappropriate Content
Hi Suzanne- This error occurs when you're attempting to add a Voxel Layer to a Global Scene. Voxels currently only work in Local Scenes.
- Mark as New
- Bookmark
- Subscribe
- Mute
- Subscribe to RSS Feed
- Permalink
- Report Inappropriate Content
Hi Phil,
I am working in Local Scene..
Suzanne
- Mark as New
- Bookmark
- Subscribe
- Mute
- Subscribe to RSS Feed
- Permalink
- Report Inappropriate Content
Hi Suzanne,
Can you click on the notification? It will bring up the notification pane which will provide more details. The most common cause is that the voxel layer coordinate system must match the scene's coordinate system. If the scene already has data and a coordinate system set then you will need to change it to match the voxel layers coordinate system. The other reasons why this might appear is if you are using OpenGL as the rendering engine but once again the notification pane will have more details. Also check out the Voxel FAQ Frequently asked questions—ArcGIS Pro | Documentation if you have a chance.
Hope that resolves it!
thanks!
Andrew
- Mark as New
- Bookmark
- Subscribe
- Mute
- Subscribe to RSS Feed
- Permalink
- Report Inappropriate Content
I suspect the problem is that the coordinate system (both horizonal and vertical) of the scene have to be the same as the Voxel layer, and the coordinate systems of the Voxel layer are driven by the EBK3D layer.
Please try adding a brand new Local Scene and immediately try to add the netCDF file as a voxel layer before doing anything else with the scene (specifically, do not add any data to it). My bet is that it will render correctly. When you add data to a new map/scene, it will set the coordinate systems to match that data, so the voxel layer and the scene should automatically be put into the same coordinate systems.
If this ends up being the issue, you can change the coordinate systems of your other scene to match the coordinate systems of the EBK3D layer, and then you should be able to add the voxel layer.
[Edit: I see Andrew beat me to it]