Turn on suggestions
Auto-suggest helps you quickly narrow down your search results by suggesting possible matches as you type.
Cancel
- Home
- :
- All Communities
- :
- Products
- :
- 3D
- :
- 3D Mapping Questions
- :
- How to make a 3d visualisation of different peat l...
Options
- Subscribe to RSS Feed
- Mark Topic as New
- Mark Topic as Read
- Float this Topic for Current User
- Bookmark
- Subscribe
- Mute
- Printer Friendly Page
How to make a 3d visualisation of different peat layer to as block diagram?
Subscribe
831
0
08-14-2014 06:12 AM
08-14-2014
06:12 AM
- Mark as New
- Bookmark
- Subscribe
- Mute
- Subscribe to RSS Feed
- Permalink
- Report Inappropriate Content
I have bore hole point data that has about 5 to 7 types of peat layer and also has several depths. I also have digital elevation data of the area.
I need to interpolate these layers separately, then visualise the layers sequentially in 3d.
Is it possible to to it with ArcGIS?
I want to add a Screen shot that may make my querry more clear:
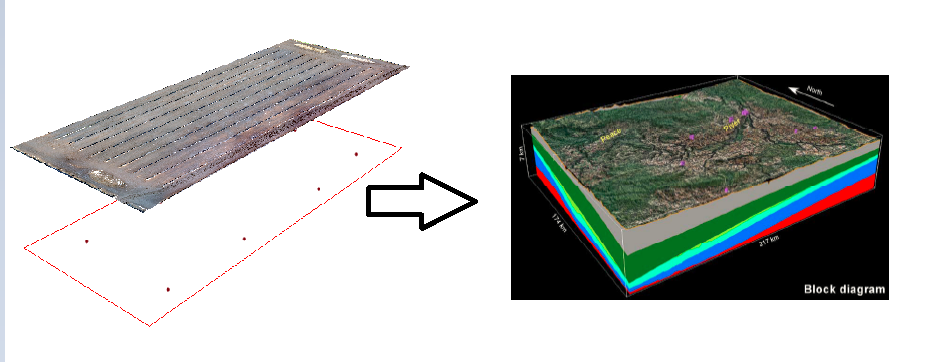
My points include the measurement depth of 4 different quality pit layer. The left image is my data set and right image is what I want from my data. I want to visualize a block diagram of formation of each peat layer. I did not find a clear description or tutorial to make the block diagram in arcscene.:-(
0 Replies