Commercial Blog

cancel
Showing results for 
Show  only  | Search instead for 
Did you mean: 

Other Boards in This Place

Latest Activity

(10 Posts)
by Anonymous User
Not applicable

As a GIS user, you may have been tasked with implementing a new GIS Systems or solution in the company, as many of us know the majority of the GIS departments are not that big, and usually, one person is doing it all, so what are the steps that you need to know to undergo this new task and encouraging the end-users to ensure the best possible success? 


Read more...

more
5 4 5,314
rsands
by Esri Contributor
Esri Contributor

When I was in grad school, I spent a lot of time working with remotely sensed data. When the June 2018 release of ArcGIS Online introduced the Relationship mapping style, it immediately activated the same parts of my brain that really appreciates false color imagery. Relationship mapping makes it easier than ever to use color to explore the relationships between variables.

If you haven’t seen read them yet, Lisa Berry’s introduction to Relationship mapping and “how to” guide provide a great overview of relationship mapping with several use cases. In the map below from Lisa’s blog, relationship mapping is used to show the similarities and differences in the spatial patterns of persons who smoke and persons who drink:

But what if I wanted to map the relationship between drinking, smoking, and some other variable at the same time?

Enter attribute-driven symbology in ArcGIS Pro. Attribute-driven symbology allows you to customize  symbols to reflect different aspects of the data by connecting your rendering properties to feature attributes. These feature attributes can include normal attributes in your data, as well as Arcade functions. The ability to leverage Arcade becomes particularly useful. As you’ll see below, we can use an Arcade function to transform three columns of data into an rgb or rgba code.

Getting Started

When I try to learn something new, I always find it helpful to start with inputs for which I know what the expected result should be. Since color combinations are important here, working with an image was a helpful starting point, so I decided to create some test data using an image from the Esri User Conference in 2019:


To use attribute driven symbology, the first thing that needed to happen was transferring the RGB values from the image to a polygon dataset. Without getting too deep into the weeds, the workflow involves converting the raster data into a polygon dataset, then using analysis tools to effectively transfer the average RGB values to a new set of polygons:


This result is a polygon feature class with three attribute fields that I wanted to use to set the red, green, and blue color values for each feature. In this case, the values represent the average red, green, and blue values from the source image within each polygon, but they could be any fields in your data.

With test data in hand, the next step is to enable attribute driven symbology, and add the Arcade function. 


Because our test data already has red, green, and blue fields, all I need to do is write an Arcade function that returns something like “rgb(111, 222, 333)”. Here’s the code I used, but you could also write an Arcade function to create RGB values from your data, or use HSL, CMYK, or one of the many other supported color formats:

function getRGB(r, g, b) {
  return "rgb(" + r + ", " + g + ", " + b + ")";
}

getRGB($feature.MEAN_Red, $feature.MEAN_Green, $feature.MEAN_Blue)‍‍‍‍‍‍‍‍‍‍‍‍‍‍‍‍‍‍‍‍‍‍‍‍‍‍‍‍‍‍‍‍‍‍‍‍‍‍‍‍‍‍‍‍‍‍‍

With attribute-driven symbology now controlling the features’ colors, the last step is to click apply and enjoy the result:


At this point, I was eager to apply this to some real data. But first I had to answer a few questions from around the office. The first one was “Did you reproject your face?” followed by “How exactly is this working?”  and lastly “Can you do this to a picture of my cat?” – to which the answers were “no,” “let me show you,” and “of course!”:

Bringing it all back together

I hope that this (less than) practical example helps paint the picture of how you can use Attribute Driven Symbology in ArcGIS Pro to link the color in your maps to the attributes in your data. Using the example I showed from the beginning of this blog, what would a map look like if we wanted to show the relationship between smoking, drinking, and obesity?

Using Attribute Driven Symbology, we can create just this map! In this case, I used Arcade to rescale all three values from 0 – 255, and return that value as an RGB code. In the new map, red represents excessive drinking, green represents obesity, and blue represents smokers. The way that the colors combine contains a lot of information. For example, yellow areas are high in both excessive drinking and obesity, but relatively lower in smoking.


Try it out!

Hopefully, there’s enough information in this post for you to start experimenting with attribute driven symbology on your own. As you experiment, it’s important to consider your audience and use case. Using color as the only way to convey information on your map can have serious implications for how accessible your maps are and may not always be a good option. Esri’s Javascript API documentation has a great reference page where you can find color ramps that meet specific criteria, including being colorblind-friendly.

For fun (and to the benefit of your social media accounts) feel free to check out this python toolbox that should make it easier to start with a picture & a polygon dataset and end up with a new dataset which you can use for attribute driven symbology. Ever wonder what a family picture would look like when mapped to US County boundaries? There’s only one way to find out!

more
5 2 4,781
EmilyKnish-Anderson
Esri Contributor

There will be a webinar this Friday March 20th at 2:00 CST to cover all of the current resources available around the COVID-19 pandemic. I will review what is available and how these resources could be used in your own organizations.

Register from the link below:


Registration: https://attendee.gotowebinar.com/regist…/1833267819664196619


At the end of the call we would also like to hear from the community about content you are creating that has been helpful and resources you would like to have.


This is a very intense time and we here at Esri are all here to help anyway we can with your GIS needs. Do not be afraid to reach out to your account team for assistance on finding data or help standing up necessary applications to stay informed about the current situation.

more
1 0 1,592
EmilyKnish-Anderson
Esri Contributor

ArcGIS Hub is gaining a lot of attention, especially with the COVID-19 GIS Hub site trending in popularity. Hub helps to assist communication and collaboration across many different use cases and audiences. Using the COVID-19 GIS Hub as an example, it looks similar to any modern web page we interact with on a daily basis. Information is clear and organized, there are even datasets that can be downloaded from the site directly. Applications, such as Dashboards for ArcGIS, can be embedded into the site pages as well. The COVID-19 GIS Hub includes many different application examples that are ready for users to interact with, along with Tweets updated in real-time about current health and risk topics. There is a lot of information on this Hub site! The Hub software gives you the ability to properly organize this data though, so it is not overwhelming for the end user. Anyone from a seasoned GIS professional to someone who knows absolutely nothing about GIS (like maybe your internet savvy Grandma) can obtain actionable information from this site.

COVID-19 Hub Site Overview

There are two versions of ArcGIS Hub, Hub Basic is included with your ArcGIS Online subscription. It is also worth mentioning that Hub Basic is similar to Enterprise Sites (in ArcGIS Enterprise). Hub Premium offers additional capabilities such as initiative management, event management, and Hub site performance tracking dashboards. You can view the complete breakdown here of the features included at each level.

Initiatives in Hub can be created around many different use cases, this can be like the example above, sharing information and data from a central page about the COVID-19 event. Initiatives can also be about outreach campaigns within communities, or a specific project a department is working on (like a project around data collection after a recent natural disaster, or important stuff like if the office should have donut Fridays). Survey 123 forms can be embedded into the Hub site to collect feedback. ArcGIS Hub also includes the ability to manage events (like an annual GIS Day event), this is a great tool to further increase collaboration among users of the site.

Still not totally clear on ArcGIS Hub? Still not sure how you could use it or why it matters? Well, luckily there are plenty of marvelous examples to hit this point home. The main ArcGIS Hub Gallery has a wealth of examples. A couple of my favorites include The Northern Tornadoes Project and the Earth Challenge 2020 Hub sites.

Some other examples that do a wonderful job showcasing Hub’s many capabilities are below:

Irelands’ Sustainable Development Goals Data Hub - Notice the great use of individual interactive cards for each sustainability goal.

Esri Australia’s Hub site built around content related to Bushfire activity - There are links to data and ready to use applications for users to be able to easily find and use.

The CUSEC Shaken Fury Hub – This is a unique example. The Shaken Fury Exercise simulates the response and recovery to a 7.7 magnitude earthquake scenario near Memphis, Tennessee. This hub site shows the coordination efforts shared from many different sources around this exercise.

The City of Los Angeles GeoHub – Is a great example of using a Hub site to share open data. The “Unlock the City’s Geodata” section is very well done.

I hope this helps to clarify how valuable a Hub site can be, and to get the creative ideas flowing around how you could start building one today! If you have built a Hub site that you are super proud of and can share, please share that with us! It is always fantastic to see the amazing content you all build, and it would be great to see examples from our Business community!

more
2 0 1,515
DennisJarrard
Esri Contributor

Introduction

Date/Time fields add a whole new dimension to analysis and visualization of spatial data. They specify an exact point in time, similar to how coordinates specify an exact point in space. When working with spatial data, generating relative content is something we naturally do all the time. For example, we might calculate an area (such as a buffer) that is anchored on an input point. Or we might measure a distance from a point to another object. The outcomes of those analyses are relative, that is, they are relative representations based on an exact starting point. By themselves, the exact coordinates might not mean much, but we can derive something of meaning and value from it.

Time works the same way. When talking about your birthday party, you could say “my birthday party on February 15th 2020, 6:00 PM”…but it’s easier for the person you’re talking to understand if you just say “my birthday party last night”. Or when your friend asks you “When will the burgers be done?”, you could say “February 26th, 5:30 PM”, when “in about 30 minutes” is going to be far more effective in getting your point across. These expressions are relative to a precise point in time: right now. In ArcGIS, dates and times are specified precisely, but you can incorporate relative representations of those dates and times in your maps to make them easier to understand. In this post, we're going to look at manipulating symbols and popups to reflect relative time.

Incorporating Relative Time in Symbology

When viewing a live feed, we might want to want to symbolize the data in such a way that, as events age, they become less and less visually significant until they phase out all together. For example, take a look at the map below. We pulled in MODIS Hotspots from the Living Atlas, applied a filter to just show the last 24 hours, and then used Arcade to categorize each hotspot to a "recentness" category. As these hotspots age, they'll diminish and ultimately disappear from view.

Map Showing Relative Time Symbology of MODIS Hotspots

With Arcade, you have the flexibility to work with your date fields in any number of ways, customize thresholds, and even calculate your own new, derived dates. Read on to learn how to build this exact map for yourself to get started.

First, lets setup the map. Open a new webmap, Click Add >> Browse Living Atlas Layers >> and search "MODIS". The first result should be a "Satellite (MODIS) Thermal Hotspots and Fire Activity" feature layer by Esri. Go ahead and add that layer to your map. In the Content pane, click on the filter button for the MODIS layer and set a filter for "Acquisition Date in the last 1 day(s)". Apply Filter. This will filter the hotspots to be in the last 24 hours. Now click Basemap at the top, and select the Dark Gray Canvas basemap.  Now it's time to use Arcade to build our own relative time symbology for the hotspots.

For the MODIS layer, click the Change Style button. Expand "Choose an attribute to show", scroll to the bottom of the field list and click "New Expression". This will launch the Arcade Expression builder. Paste the following code into the Expression body.

function determineCategory(value){
    if (value <= 4 ){
        return "1"
    }
    else if (value > 4 && value <= 8){
        return "2"
    }
    else if (value > 8 && value <= 12){
        return "3"
    }
    else if (value > 12 && value <= 16){
        return "4"
    }
    else if (value > 16 && value <= 20){
        return "5"
    }
    else {
        return "6"
    }
}

var hours = DateDiff(now(),$feature["ACQ_DATE"], "hours")
determineCategory(hours)‍‍‍‍‍‍‍‍‍‍‍‍‍‍‍‍‍‍‍‍‍‍‍‍‍‍‍‍‍‍‍‍‍‍‍‍‍‍‍‍‍‍‍‍‍‍‍‍‍‍‍‍‍‍‍‍‍‍‍‍‍‍‍‍‍‍‍‍‍‍‍‍‍‍‍‍‍‍‍‍‍‍‍‍‍‍‍‍‍‍‍‍‍‍‍‍‍‍‍‍‍‍‍‍‍‍‍‍‍‍‍‍‍‍‍‍‍‍‍‍‍‍‍‍‍‍‍‍‍‍‍‍‍‍‍‍‍‍‍‍‍‍‍‍‍‍‍‍‍‍‍‍‍‍‍‍‍‍‍‍‍‍‍‍‍‍‍‍‍‍‍‍‍‍‍‍‍‍‍‍‍‍‍‍

You can modify the thresholds for each category here if desired. Just keep in mind that the filter we applied to the layer only displays those hotspots that were recorded in the last 24 hours. If you happen to be working with a different layer, you'll need to replace the $feature["ACQ_DATE"] so it's pointing to a date field in your layer. Click "Test" to make sure it's working. If it's successful, you should see a Result value of 1-6 (1 being most recent, 6 being oldest). Click OK to apply the script.

The "Unique symbols" types will automatically be selected. Click Options to modify how these display. Modify the symbol order to 1-6 by dragging the entries to the appropriate position. Now that everything is in the right order, go ahead and change the Labels for each category so that they are reflective of the time range.. I used "In the last 4 hours" for the first one and a schema of "X to Y hours ago" for the last five. Alright, now we're ready to create the symbols. Click on the first symbol to open up the Symbol Changer. Click Shape, open the dropdown, and select "Firefly". The ramp I used was the light green to red ramp.
Firefly Ramp

Select the most intense one on the ramp (the farthest to the right), and set the size to 36. Repeat this process for the other categories, working your way left on the ramp, and decreasing the size each time by 6 (e.g. 36, 30, 24, 18, 12, and 6). Once all your symbols are configured how you like, go ahead and play around with the Transparency slider in the Style pane to dial in the look you're going for. When it's all said and done, your Style pane should look something like this:

Symbol Pane

Click OK to lock it all in. And, voila! You should now have a map of MODIS hotspots that age over time based on current time. Great work! Also, don't forget to save your map!

Incorporating Relative Time in Popups

You can also setup relative time expressions in your popups and transform a precise date and time into something a little more human-friendly. For example, go back to the example map provided toward the top of this post. If you click a hotspot, in the popup you'll see the exact date and time as well as a relative expression like "2 hours and 5 minutes ago". That second part is being calculated by Arcade on-the-fly as well. 

To set this up in your own map, open the "Configure Popup" pane for the MODIS Hotspot layer. Click "ADD" under the Attribute Expressions section. This will launch another Arcade Expression builder. Paste the following code into the Expression block:

var myDateField = $feature["ACQ_DATE"];

function getTimeDelta(alertDate){
    var minutes = DateDiff(now(),alertDate, "minutes")
    var hours = DateDiff(now(),alertDate, "hours")
    var days = DateDiff(now(),alertDate, "days")
    if (minutes <= 120){
        return round(minutes) + " minutes ago"
    }
    if (minutes > 120){
        if (hours <= 48){
            var tFloor = floor(hours)
            var deltaMin = datediff(now(),dateadd(alertDate,tFloor,'hours'),'minutes')
            return round(tFloor) + " hours and " + round(deltaMin) +  " minutes ago"
        }
        if (hours > 48){
            var dFloor = floor(days)
            var deltaHour = datediff(now(),dateadd(alertDate,dFloor,'days'),'hours')
            return round(dFloor) + " days and " + round(deltaHour) + " hours ago"
        }
    }
}
return getTimeDelta(myDateField)‍‍‍‍‍‍‍‍‍‍‍‍‍‍‍‍‍‍‍‍‍‍‍‍‍‍‍‍‍‍‍‍‍‍‍‍‍‍‍‍‍‍‍‍‍‍‍‍‍‍‍‍‍‍‍‍‍‍‍‍‍‍‍‍‍‍‍‍‍

This expression will look at the time delta between the current time and the date in the field and use some conditional logic to build a human friendly expression of that delta. This expression is built to also work with Days, but since we've setup our hotspots to only see the last 24 hours, we won't see that. But you can use this expression as a template to for other layers you want to work with. In that case, the only thing you'll have to do is change the $feature["ACQ_DATE"] bit to point to a date field in your layer. 

Click Test to verify it works, followed by an exuberant click of the "OK" button. From here, configure the popups however you like, making sure that the expression you created is visible. The expression acts like a field, so you can see it as part of a default popup style or configure it as part of a custom attribute display.

Popup

Arcade gives you the flexibility to customize how things are conveyed to your audience without requiring you to modify the schema of your data or run constant field calculations. Temporal representations is just one use case of that. Hopefully this gives you a start to exploring whats possible. Thanks for reading!

more
5 5 2,804
DennisJarrard
Esri Contributor

I recently came across a scenario where I had to evaluate many fields across a table and, for each record, determine which field had the highest value. At first, I thought this would be easy. It’s just a field calculation with some if statements, right? The problem was that I had to evaluate over 50 fields. This means I had to explicitly account for every field I wanted to evaluate. My field expression was long, tedious to build, and completely unusable for any other data that I’d want to do this for. At the same time, I realized that being able to evaluate values across a table is a useful idea that is applicable to all sorts of data. 

Sometimes in a collection of data there is a group of fields that represent a series. For example, for each branch or retail location, I might have annual revenue for each year in different fields (e.g. Rev2015, Rev2016, Rev2017, Rev2018, Rev2019 etc.). What if I want to simply evaluate, for each branch, which year had the highest (or lowest) revenue? Or what if I want to determine, for each branch, what the top three years for revenue are? Another scenario is a situation where I may have GeoEnriched many fields to a table. For example, I may have appended dozens of different consumer spending variables. What if I want to determine, for each trade area, which spending variable had the highest (or lowest) values? Or what if I want to rank the top three consumer spending values for each record? 

Some of these questions can be answered through custom Field Calculator expressions, but it’s a process that quickly becomes very tedious if you’re evaluating more than a few fields, and the expressions you create will be very much linked to the data structure. For example, I can’t take the expression I built for comparing revenue years and use it for comparing consumer spending variables without carefully modifying the script. And if you’re needing to rank fields and write the results to multiple fields? Field Calculator, at least by itself, won’t help you there because it can only write to a single field at a time. The solution: python script tools! 

Now don’t worry, I’m not going to walk you through the process of building a python toolbox, give you a few snippets, and wish you luck. What I’m here to do is share work that I’ve already done in building a flexible tool that tackles this challenge. In fact, you can download the tool today and test it out yourself…no coding, no configuration needed! 

Once you’ve downloaded the toolbox, browse to it in ArcGIS Pro, expand the toolbox, and you’ll see two different tools at your disposal. 

Evaluate Extremes Across Table - Evaluates each record in a table across a defined set of columns to find the highest or lowest values. These results are written to three new fields in either the input dataset or a new output file. The three new fields describe, for each row, the highest or lowest value in the evaluation, the name of the field that contained that value, and whether there was a tie between the winning field and another field. Here’s what the interface looks like:

 A Screenshot of the "Evaluate Extremes Across Table" Tool

As an example, I geoenriched 15 consumer spending indexes to drivetime-based trade areas, and ran this tool to figure out which index was highest for each trade area.

 A Screenshot of the output of the "Evaluate Extremes Across Table" tool

We can also reverse the analysis and identify which spending categories indexed the lowest for each trade area. Another useful feature highlighted here is Tie Detection. If two or more fields won out for the most extreme value, the tool lets you know through a field.  

A Screenshot of the output of the "Evaluate Extremes Across Table" tool

Rank Values Across Table - Evaluates each record in a table across a defined set of columns to rank the n top or bottom values. These results are written to a number of new fields in either the input dataset or a new output file. The number of new output fields is dependent on the number of ranks specified. Each rank will create two new fields. For example, if 3 ranks are desired, 6 new fields will be created. The two new fields per rank describe, for each row, the name of the field containing the ranked value, and the ranked value itself. Here’s what the interface looks like: 

A Screenshot of the "Rank Values Across Table" tool 

Working off the same example data we used in the first tool, we can use this Ranking tool to show us the top 3 spending categories that indexed highest for each trade area. 

A Screenshot of the output of the "Rank Values Across Table" tool

Conversely, we can also figure out the 3 bottom categories on the same set of data. 

A Screenshot of the output of the "Rank Values Across Table" tool

All of the documentation for each tool is in the Github repo itself, so I won’t get into it here. However, it’s worth reading through it before you start working with it. I’ve built a few niceties into the tool such as tie detection, alias handling, ranking controls, and support for evaluating multiple fields types at the same time. That’s right, you don’t have to do a bunch of field type conversions to make sure they all match up…that’s all handled by the tool as long as the fields are of a numeric type (short, long, float, or double). 

Hopefully this will be useful for someone struggling with the same challenge I had. Keep in mind, it’s not perfect, and I guarantee that there are bugs in there. If you run into any of them, or have ideas on how to make the tool work better, please submit an issue on Github so I can continue to improve on it. Happy calculating! 

more
3 0 910
EmilyKnish-Anderson
Esri Contributor

Have you made the transition to ArcGIS Pro yet for your Business Analyst Desktop workflows? If not, you might want to consider spending some time in ArcGIS Pro familiarizing yourself with the Business Analyst tools that are currently there. ArcMap still has a special place in my heart, but ArcGIS Pro is my new best friend. It is time it becomes your best friend too (if it is not already).


The purpose of this article is to give you a current picture (as of May 2019) of the amazing Business Analyst capabilities that are present in ArcGIS Pro. Also, we will start with a quick overview as to why ArcGIS Pro is something you should be using more. This article should help give you a nice summary and hopefully make you want to instantly open ArcGIS Pro and explore the BA toolset!


Why should you use ArcGIS Pro?


Why is Pro so wonderfully amazing? Let's focus first on performance. It is a 64 bit multi-threaded application, the CPU can process multiple threads of execution simultaneously. Basically, it is fast. It has a project based structure, so it is easier to keep your workflows organized. You can have many different maps and layouts in the same project. The user interface is ribbon based and interactive based on what layers you select, you no longer have to scroll through the long list of available toolbars to find and add the right one! It smoothly integrates into your web GIS environment. You can easily publish, access, and update content in either Portal or ArcGIS Online. You can also access tools that are ready-to-use from the ArcGIS Online services.


Now, let's move on to the heart of this article, the Business Analyst tools licensed in Pro. The following is a quick summary of the tools available now (with links to the main ArcGIS Pro documentation about the tools), and then we will look at a few of the new tools in more detail.


Summary of Business Analyst Tools in ArcGIS Pro


Currently in the Analysis toolset in the Business Analyst toolbox you will find Calculate Market Penetration, Color Coded Layer, Enrich Layer, and Generate Desire Lines. With the Reports toolset you can run a Summary Report using Esri templates. The Suitability Analysis toolset gives you the capability to run suitability analysis in ArcGIS Pro. The Trade Areas toolset contains the Generate Customer Derived Trade Areas, Generate Geographies from Overlay, Generate Standard Geography Trade Areas, and Generate Trade Area Rings tools. The Territory Design toolbox is also a powerful set of tools available with the Business Analyst license in Pro.

 A Market Penetration layer calculated using population of zip codes compared to a point layer of customer data and weighted using their spending totals. This helps us see areas where we have more saturation (red) and areas where we have gaps in our market (shades of blue and purple).

A Market Penetration layer calculated using population of zip codes compared to a point layer of customer data and weighted using their spending totals. This helps us see areas where we have more saturation (red) and areas where we have gaps in our market (shades of blue and purple).


The Enrich Layer tool is a great way to enrich data making use of the locally installed or online Business Analyst data you have. The output is a copy of your data with the demographic variables you selected. The Generate Desire Lines (spider diagrams) tool is something I know many of my customers use quite often to understand relationships between customer locations and their stores. To create a quick choropleth map (that is scale dependent, containing multiple levels of geography), this is where the Color Coded Layer tool would be used. One of the newer tools is the Calculate Market Penetration tool. This is useful in understanding the comparison of customers in a specific area compared to a demographic variable (Let's say you wanted to compare the concentration of your customers to the total population).

Color Coded Layer 
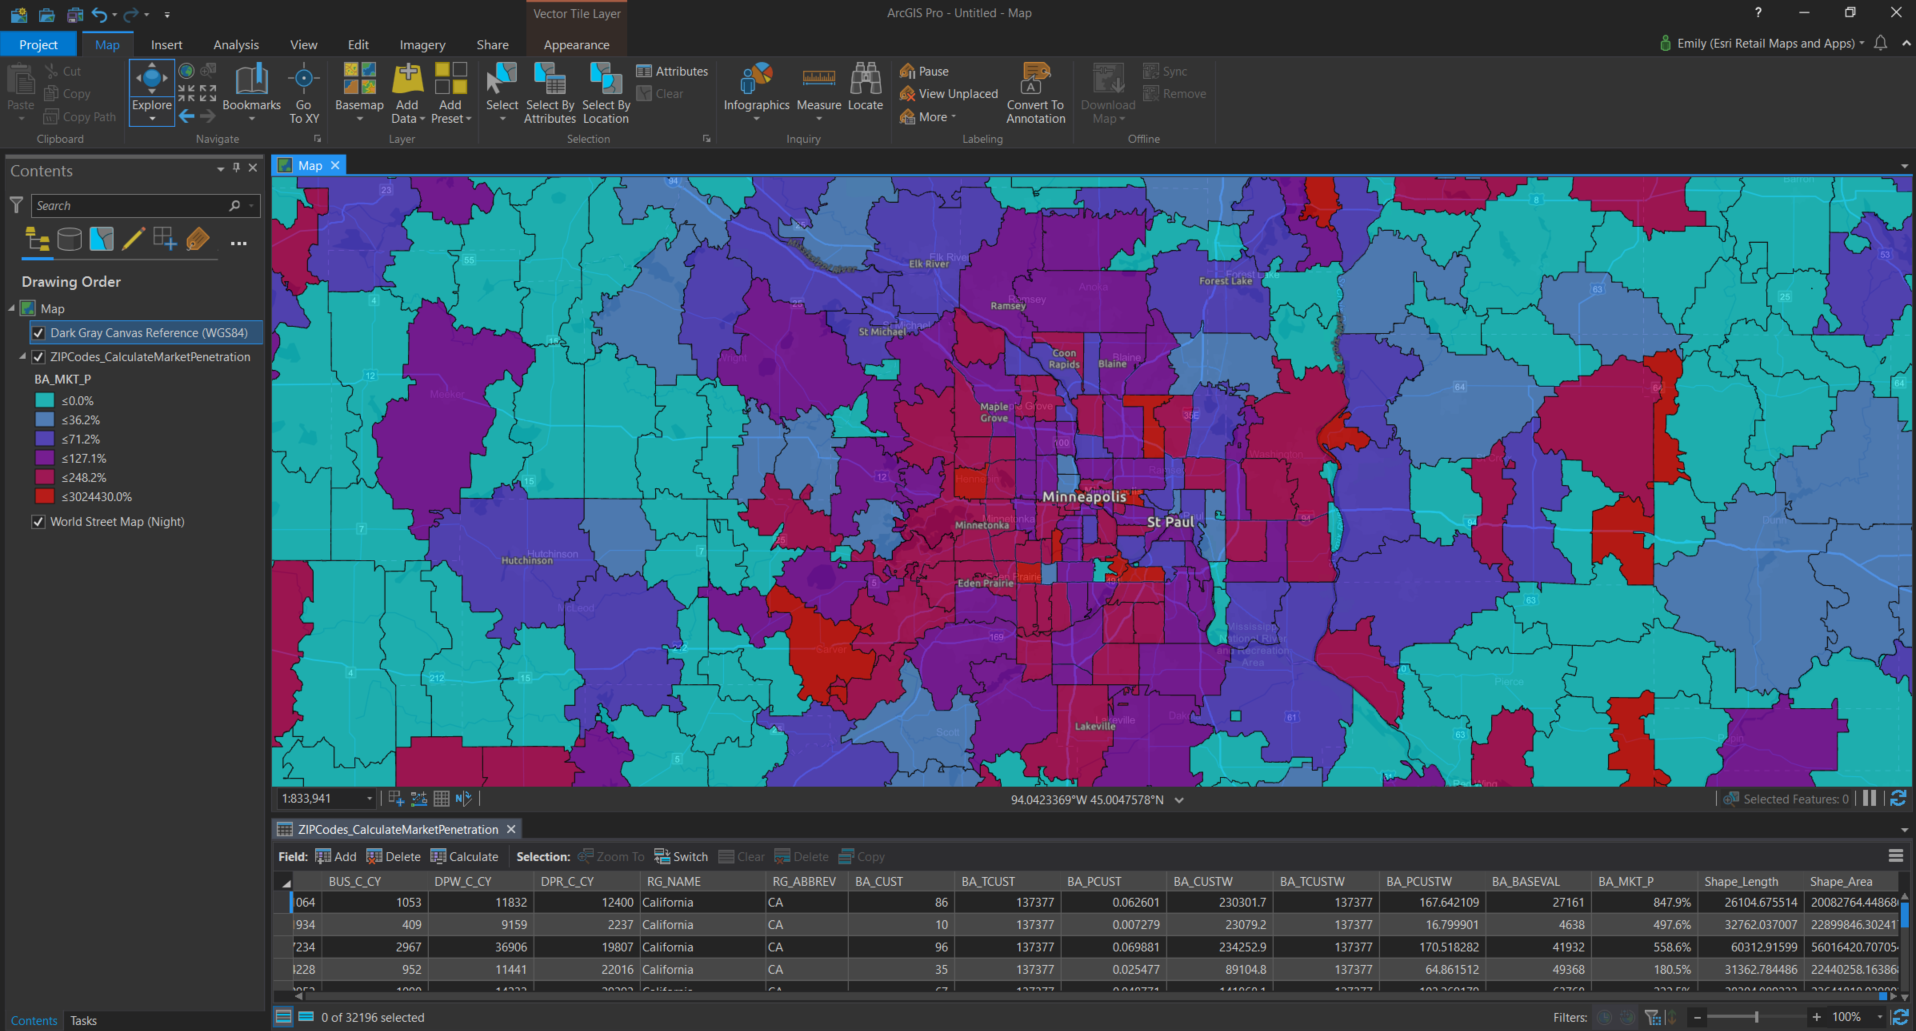
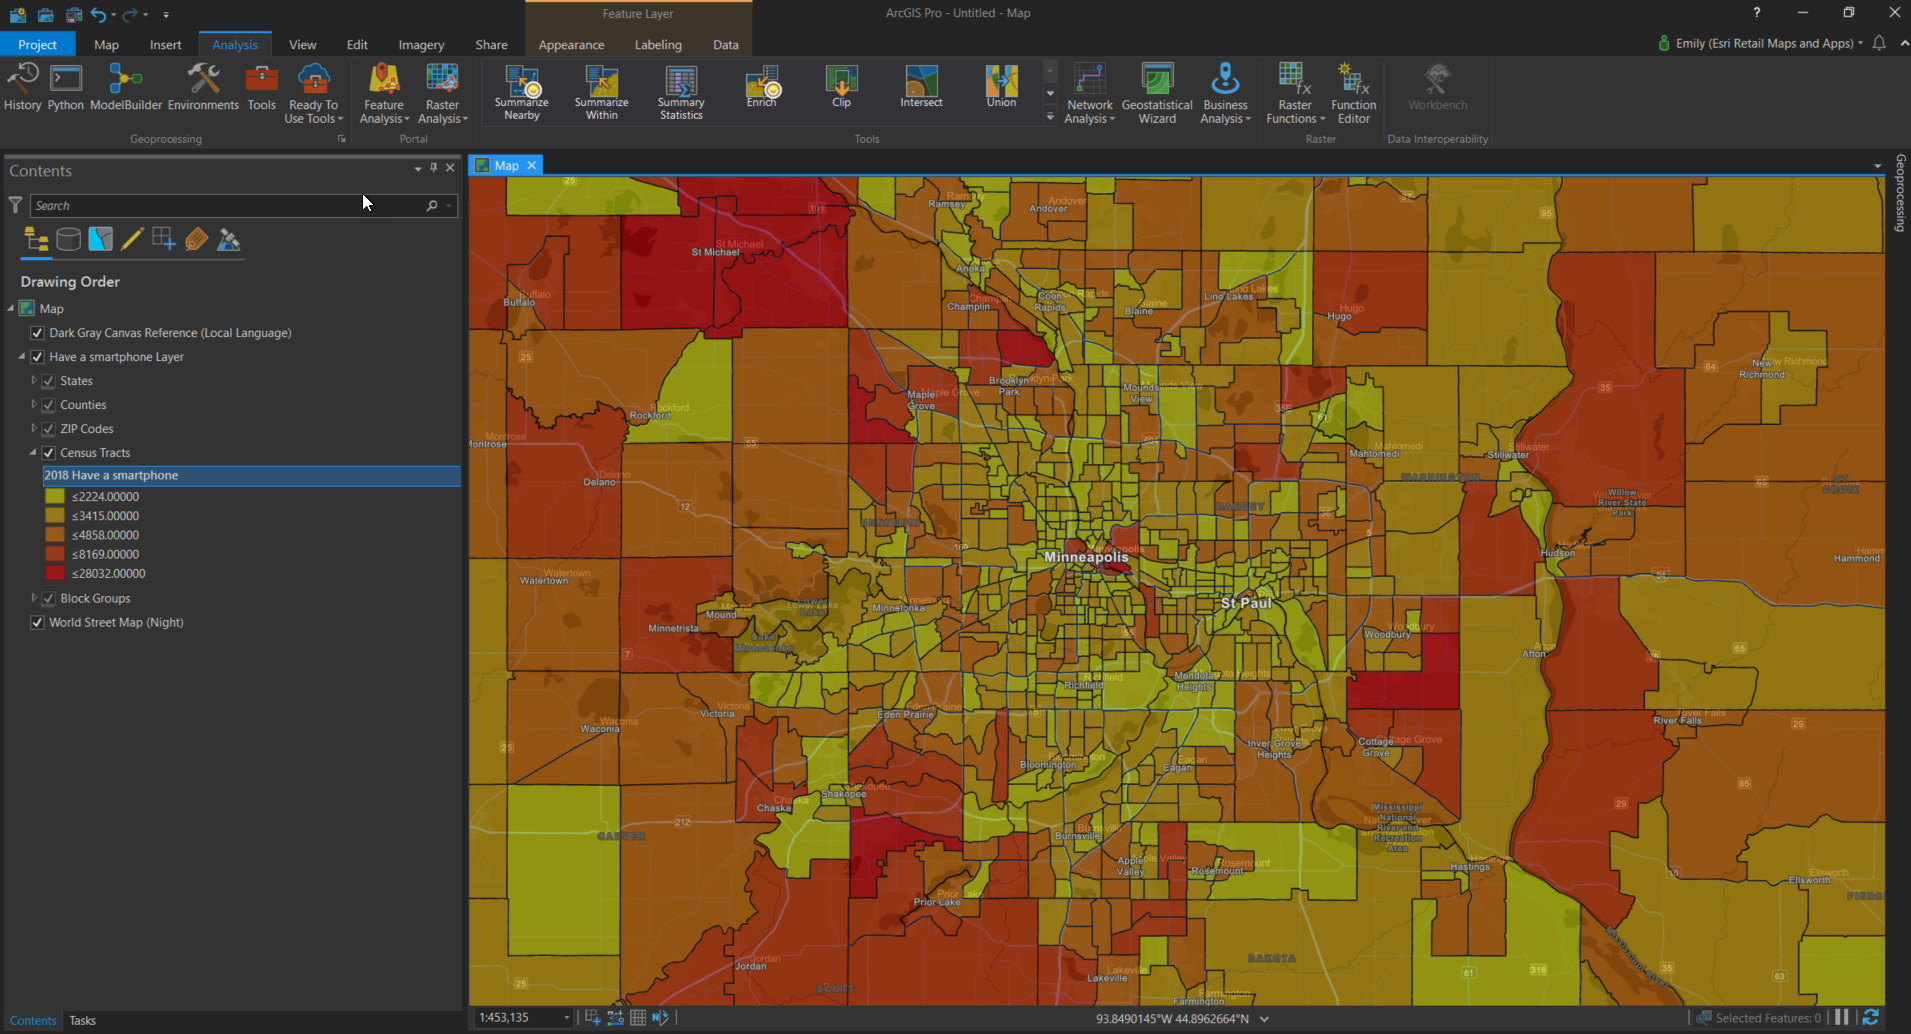
Color Coded Layer example of the expected number of individuals who have a smartphone


Brand New Capabilities That do not Exist in the Business Analyst Extension in ArcMap!


The Suitability Analysis toolset is a great addition to Pro. It contains all of the tools you need to create and update a suitability analysis workflow, similar to Business Analyst Web, but with more options and it can handle many more input features for the suitability ranking. For example, this is great when you are trying to narrow down markets across the United States where pet ownership and disposable income are high to increase revenue for your pet clothing company. When weights on the variables are adjusted, this will update the suitability score results on the fly! The video below shows the adjustment of the suitability criteria and the live update that occurs on the scores. The example shows scores for 15 minute drive time trade areas, there are over 3,100 features.  This tool is available in ArcGIS Pro, not in ArcMap.


The last item I want to point out is the ability to run infographic reports in ArcGIS Pro. Infographics are a great way to summarize important information in a format this is user friendly and easy for many different audiences to understand. You are able to run any of the many Esri created templates (using global demographic data is an option) or custom infographics created by you in Business Analyst Web or those that other Business Analyst Web users have shared with you. The video below shows how you run the infographics in Pro. You do not need to be licensed with the Business Analyst extension in Pro to run infographics, but you will need a Business Analyst Web license to customize the templates.


Final Summary, Upcoming Release and Important Links


The Business Analyst tools in Pro are powerful so please take the time to get more familiar with these features today! If you are not currently licensed and would like to be, contact your friendly Esri Account team for more information. Some resources worth mentioning are listed below, they are great sources of information on future updates to the Business Analyst software and places to look for assistance with using the tools (bookmark these links if you are an active user!). Also, please make use of the large and knowledgeable community here, ask questions and post feedback!


There are many exciting updates planned for Business Analyst for ArcGIS Pro before the Esri User Conference in early July. You will be able to search for businesses and facilities, share custom data to users in your organization, analyze market potential with the Huff Model, and balance territories using a street network. For more information read this blog post by Praveen Srivastava about these updates and others across the BA product family.


Enjoy all of the capabilities you now have with Business Analyst in Pro!


Business Analyst GeoNet Community Page - https://community.esri.com/groups/business-analyst

ArcGIS Blog Posts from the Business Analyst Team - https://www.esri.com/arcgis-blog/?s=#Business%20Analyst

Business Analyst YouTube Channel - https://www.youtube.com/playlist?list=PLGZUzt4E4O2KQIgWq0fiJdEenmNgvYzOe

Business Analyst for ArcGIS Pro Documentation - https://pro.arcgis.com/en/pro-app/help/analysis/business-analyst/what-is-business-analyst-pro.htm

ArcGIS Business Analyst User Group in LinkedIn - https://www.linkedin.com/groups/2773587/

more
5 5 3,473
SimonThompson
New Contributor III

I’ve had a chance to review many of the post Business Summit interview and was struck by the comments of Jon Voorhees from Bank of America; one of our biggest and brightest financial services clients. He said

“While we may be ahead of most of our competitors, we are so far behind where the technology can provide for us today. And we've got to catch up, because someone's going to pass us in their ability to think better; have better insight; and therefore make better, faster decisions.”

Two things stand out for me about technology, location analytics and business:

  1. Any organization is only as good as its ability to apply the business value it gets from technology and
  2. You need to continually evaluate how you make decisions and challenge the status quo. 

We’re all accustomed to new feature and changes in software and companies invest in training to learn those features but it strikes me that not enough companies realize that they need to evolve their business thinking too.  As @PhilSimon points out 

“In the Age of the Platform, complacency is just about the worst mistake you can make. If you don't cannibalize your own business, your competition will.”

And that’s the crux, technology will only take you so far. It’s people that matter and how they think. How you empower them to take the company in new directions, to apply novel ideas and use technology in more intelligent smarter ways – that’s what keeps your business fresh and competitive. Esri continues to make our software easier to produce powerful, insightful visualizations and analytics and that’s arming people with new skills and opportunities to apply location analytics to get ahead and keep ahead.

more
7 4 5,196
MeghanKaravidas
Occasional Contributor

How a new kind of business intelligence is driving business success through happy people, health communities and a better bottom line

Close to 400 people put their businesses on the map at the Esri Business Summit, starting on Saturday, July 11 at the Hilton Bayfront Hotel. Attendees from as far away as Japan, Canada, Colombia, Brazil, Thailand and the United Kingdom came to hear more than 40 speakers discuss how GIS and location analytics are making a difference at their companies, for their people and in their communities.


From Subjective to Objective

John Crouse with The Wendy’s Company

John Crouse, the director of real estate services for The Wendy’s Company started the conference by talking about how the popular fast food chain is using Esri technology to make more informed decisions by understanding their customers’ behaviors – a challenge because Wendy’s doesn’t collect customer data through loyalty cards or other means.

Wendy’s relies on Esri’s Tapestry data to give them insight into who their customers are and help them avoid opening restaurants in the wrong locations.

“GIS takes the subjectivity out of our work and helps us do things that benefit the company,” said Crouse.

Crouse estimates that in the first two years, the company potentially saved up to three-quarters of a million dollars.

A better work environment through GIS

The benefits of GIS outlined during the four days of the conference were many and they didn’t stop at just helping the bottom line.

Jeff Rivera the vice president of national account sales at Con-way Freight, a $5.5 billion freight transportation and logistics services company, talked about how integrating GIS into their “lean” business culture helps improve the working conditions of their drivers.

Jackpot

Jeff Rivera, vice president national account sales, Con-way Freight

He introduced the audience to Jackpot, a Con-way Freight driver. Jackpot has driven two million miles over the past five years without an accident or an injury—an incredible feat in light of all the things that can go wrong on the road including broken down rigs, traffic congestion, and customers late with shipments. And when Jackpot is late, or misses a delivery window, it is frustrating to both the customer and to Jackpot.

Esri is helping Con-way understand what obstacles drivers like Jackpot encounter and make those hidden wastes visible. For example, using ArcGIS, managers are able to see where there is unnecessary wait time, heavy traffic or bad routes and provide alternative scenarios to save time, money and eliminate waste. This improves morale, job satisfaction and, ultimately, service to customers.

“Esri provides a clear solution to transform how we route our drivers so we can eliminate waste and increase value,” said Rivera. “Esri solutions helped us work with our customers differently.”

A part of the community

Another company dedicated to its employees is Chick-fil-A. Chick-fil-A is a privately owned fast food restaurant chain headquartered near Atlanta, Georgia. Steady growth since the first restaurant opened in 1967 has led Chick-fil-A to become the largest quick-service chicken restaurant chain the United States, with more than 1,700 locations in 39 states, bringing in sales of more than $4.6 billion annually.

Chick-fil-A’s Chan Lee, a senior analyst, spoke about the company’s success and its dedication to their operators. He attributed their success to their operators’ dedication to the communities where they are located.

Chan Lee, Chic-fil-A

Because the operators are so integrated with their local communities, it is important to ensure that other restaurants aren’t opened in established markets. This is possible by using Esri technology because it provides visibility into where customers are coming from.

“We really care about our operators and our customers,” said Chan. “So, we are very careful about placement and cannibalization. The only way to ensure we don’t have cannibalization is through GIS.”

Starting in child pose

Booth Babcock, the integrated planning manager for Lululemon also talked about the perspective of community first. Lululemon is a high-end, international athletic apparel company headquartered in Vancouver, British Columbia, Canada. The company was founded in 1998 as Babcock describes, “by a bunch of yogis” to fill a gap in the clothing market for active women participating in sports.

The company sets the bar in technical fabrics and functional designs, working with local communities for research and product feedback. Lululemon has grown from one local store to around 250 and has successfully branched into men’s and young girls’ wear.

Booth Babcock, Lululemon

Babcock said the company was looking for a solution that was fast and affordable, and they found that in Business Analyst Online.

“We wanted to sign up and instantly have access to mapping,” said Babcock. “We’re not really software guys, but after twenty minutes, we were up and running.”

BAO provides the data Lululemon needs for every North American market, and they now use this as a base to build all their systems.

“This works well because we can replicate the same workflows over and over,” said Babcock. “And it’s not a black box, we can do whatever we want with it.”

The best part? According to Babcock, starting small with BAO means that they can handle the occasional misfire—like the rest of the company – in style. They can drop the project and move on.  This has helped them make their company’s bottom line, as well as that of their customers (thanks to those great black stretchy pants they are so well known for) – look good.

Going from ‘can I do it?’ to ‘I did it!’

Karan Singh, the director of research and strategy of General Growth Properties agrees that starting small – in this case with ArcGIS Online – was the key to them going from ‘can I do it?’ to ‘I did it.’

Karan Singh, GGP

General Growth Properties operates 120 regional malls across the United States, including some of the most well-known shopping centers: Tysons Galleria in Washington, D.C., Los Angeles, California’s Glendale Galleria, and the Ala Moana Center in Honolulu, Hawaii.

ArcGIS Online allows analysts to view each mall and drill down to individual stores to analyze store performance. Integrating locational, market and geographic data with sales and tenant-level analytics is giving analysts and managers a better way to manage store mixes and jump in when there is an issue.

“Our demographics change every day,” said Singh. “One day we might be engaging with Lululemon, and the next with Brighton Collectibles, so it’s important that we understand the people who come and shop at our malls, and that we present this to our retail customers.”

To learn more and see the other exciting presenters, visit esri.com/bizsummit.

- See more at: http://blogs.esri.com/esri/ucinsider/2014/07/16/a-yogi-a-truck-driver-and-a-realtor-walk-into-a-conf...

more
3 0 4,011
SimonThompson
New Contributor III

As we head into the Fourth of July weekend, the US has risk mapping issues on both coasts. In the West California is going to speed up its quake fault mapping program based on increasing transparency and scrutiny partly led by the Los Angeles Times which has an excellent report here California acts to speed up quake fault mapping - Los Angeles Times

After a couple of decades in which budgets were cuts and the public’s attention to earthquake risk slipped, this important issue is back on the table for local governments, real estate developers, home owners, schools and the general public. And that’s a good thing. Earthquake faults and other public hazard data are readily available on ArcGIS Online and Esri supports open data initiatives that deliver live, near real-time and historic data for all business sectors and organizations. A subset can be found here:

Which  brings me to Tropical Storm Arthur which is threatening East Coast celebrations as I write this. , see a BBC report at http://www.bbc.com/news/world-us-canada-28132465

Much of the same data that international news organizations, first responders, planners and local forecasters use is available to ALL Esri users and it comes from authoritative sources too. This is easily integrated into analysis services in ArcGIS Online, desktop or any of the tools, templates and applications that come with Esri’s Location Platform. From supply chain risk analysis to modeling potential losses in insurance, estimating flooding or trying to see if my 4th July barbeque is going to be rained out, ArcGIS Online is a great starting point.

There’s a great many places to start and resources to get you going, So go on take the time to explore ArcGIS Online, you never know what you might find.

more
3 0 3,887
31 Subscribers