Mostly Mapping Maps of the Day - Hurricanes Harvey and Irma
- Subscribe to RSS Feed
- Mark as New
- Mark as Read
- Bookmark
- Subscribe
- Printer Friendly Page
- Report Inappropriate Content
Hurricanes Harvey and Irma have, for the most part, passed. However the total damage is still being realized, economic impacts are still being assessed, and recovery operations are just beginning. It will be a process that takes months and years.
During the continuing course of the response, many maps and apps have been created that were, and remain. key in providing updates on status, helping those in need, delivering insights to what happened, and perhaps most importantly, delivering information on what was going on. Here's my pick of a few apps that caught my eye, and the configurable apps and builders used to create them.
Note that this is not a comprehensive list, and many fine apps went by unnoticed by me, and many were private and subsequently not highlighted here. Feel free to comment and add others.
*
Story Map "Catalog"
An idea came about that a story map could be used as a live catalog of useful resources that could be viewed, and then opened in full screen mode and bookmarked, or otherwise saved for further use. Two of these were developed, and continue to evolve today. Both are based on the Story Map Series using the Side Accordion Layout.
One of the catalogs was targeted at operations staff - those who do not author maps or apps but need to know about and use useful applications. The other was targeted at GIS staff who were looking for key layers and web maps from which to create their own. Shown below is the Story Map Catalog of ready-to-use apps. The content has changed over time, starting with apps focused on preparedness, then response, and increasingly recovery.

*
Story Map Series "Binder"
Story Map Series, especially the tabbed layout, is often used as a binder to pull together related maps and applications. Shown below is one from the NOAA/NWS/NHC Storm Surge Unit showing storm surge flooding along the U.S East and Gulf Coasts and Puerto Rico during Category 1 though 5 storms.
*
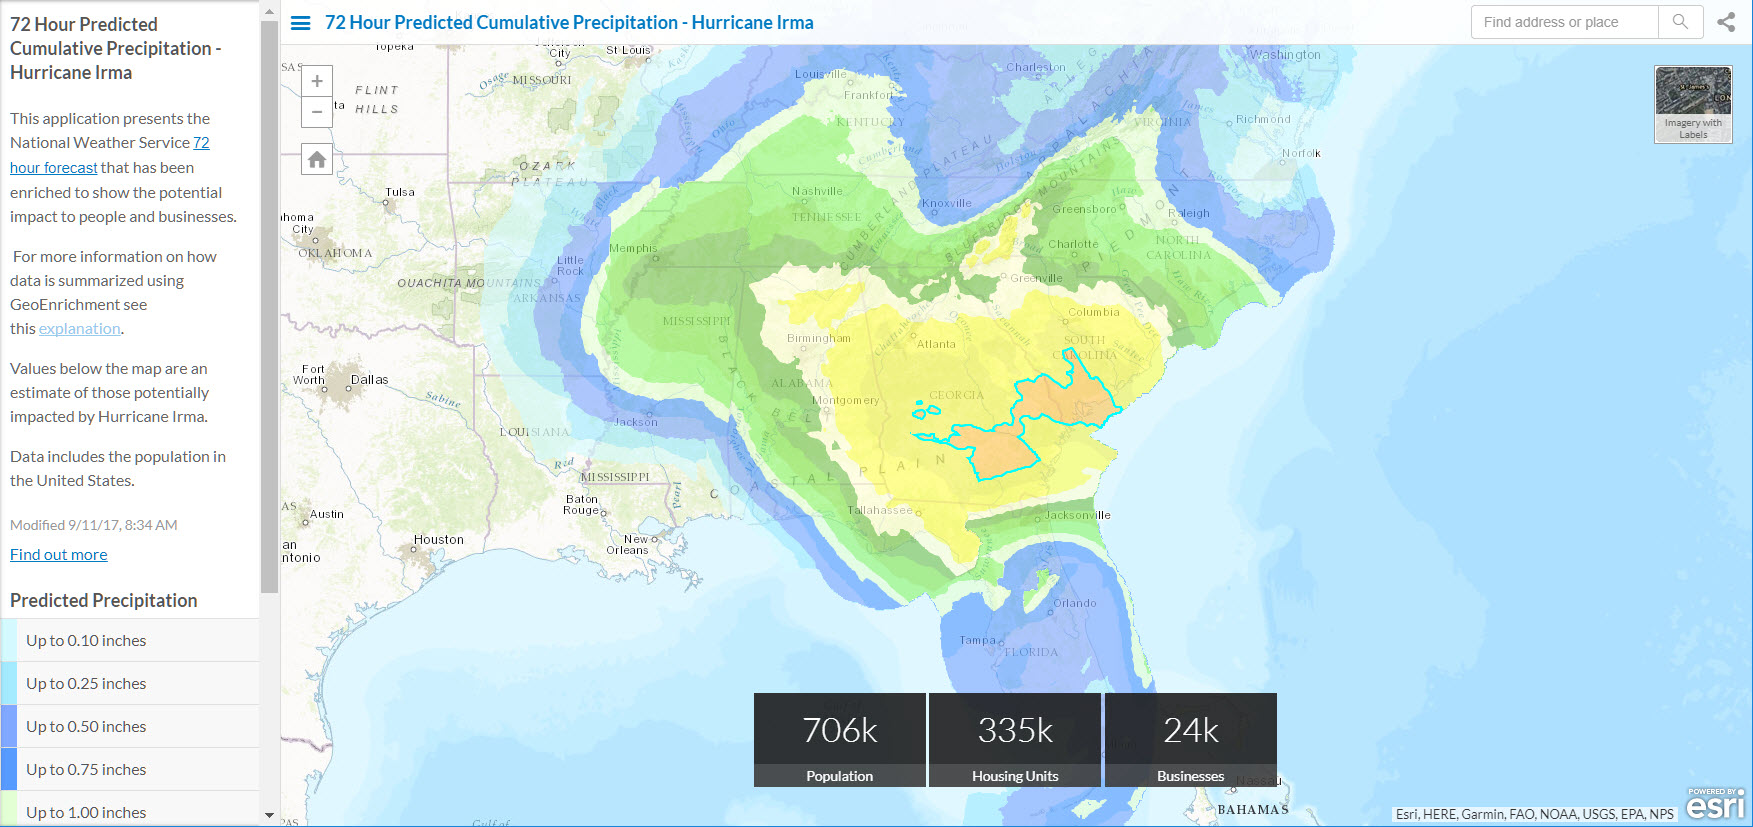
Impact Summary
One of the more widely used configurable apps was Impact Summary. This app highlights an area and shows a summary of quantitative data related to its location, with the option to use Living Atlas demographic information to enrich the data to be summarized. Shown below is an Impact Summary app presenting the National Weather Service 72 hour forecast that has been enriched to show the potential impact to people and businesses.
*
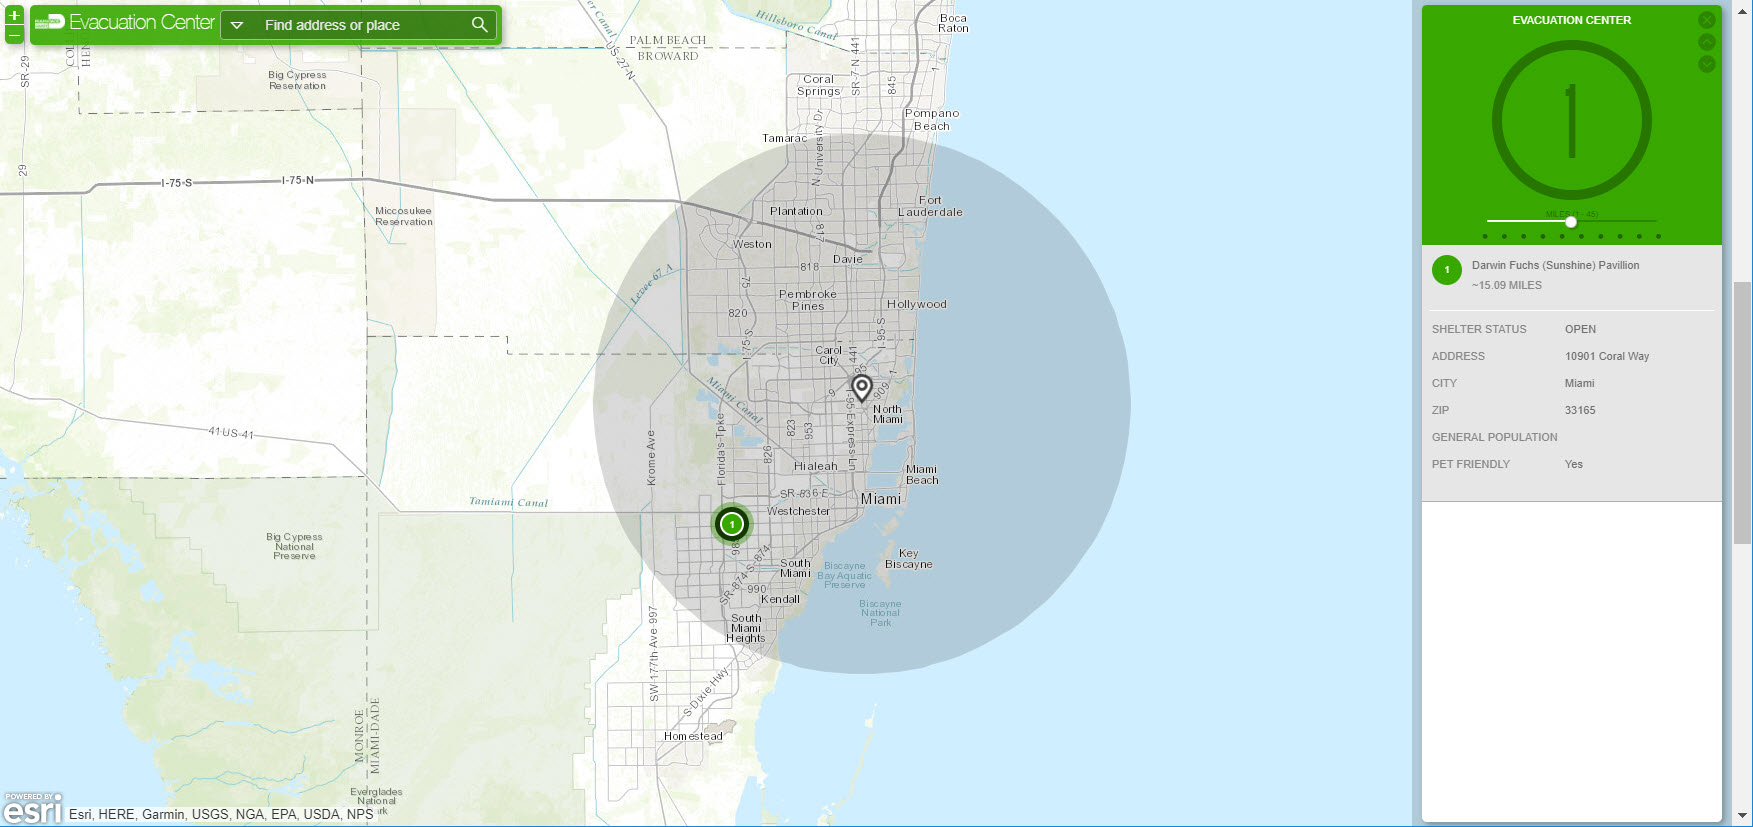
Local Perspective
Local Perspective is a configurable app template that provides information based on a user defined location. A buffered distance around the user specified location―either by typing in an address, or clicking the map―is used to return features from features layers in the map.
Shown below is a Local Perspective app authored by Miami Dade County to show shelter locations - enter an address, or click on the map to display the list, and view status. Note that the screen shot below was taken after the initial response efforts, and only displays one active shelter as a result.
*
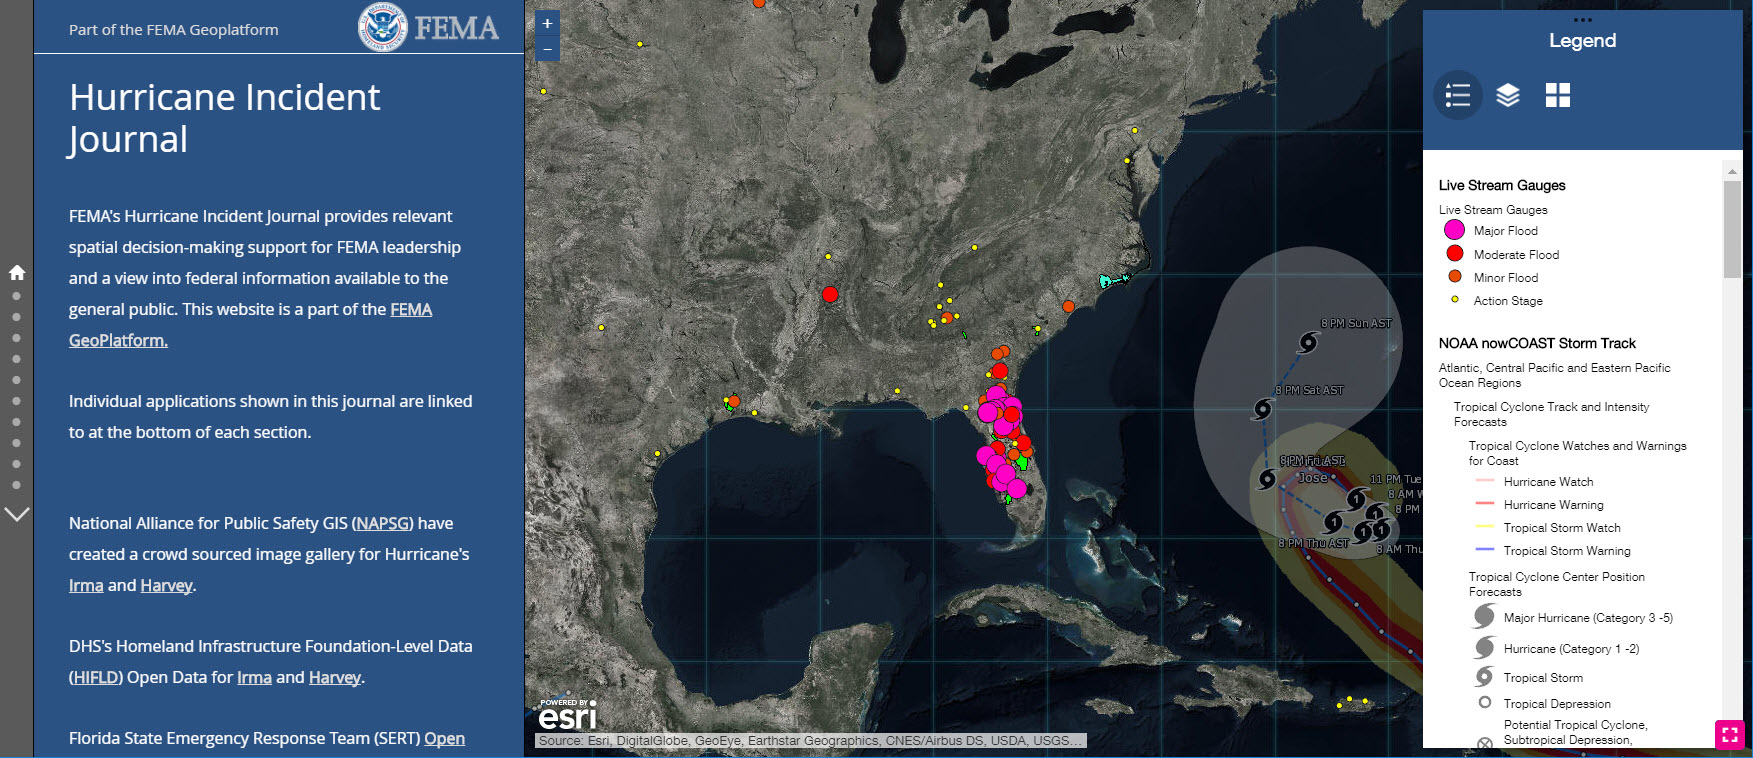
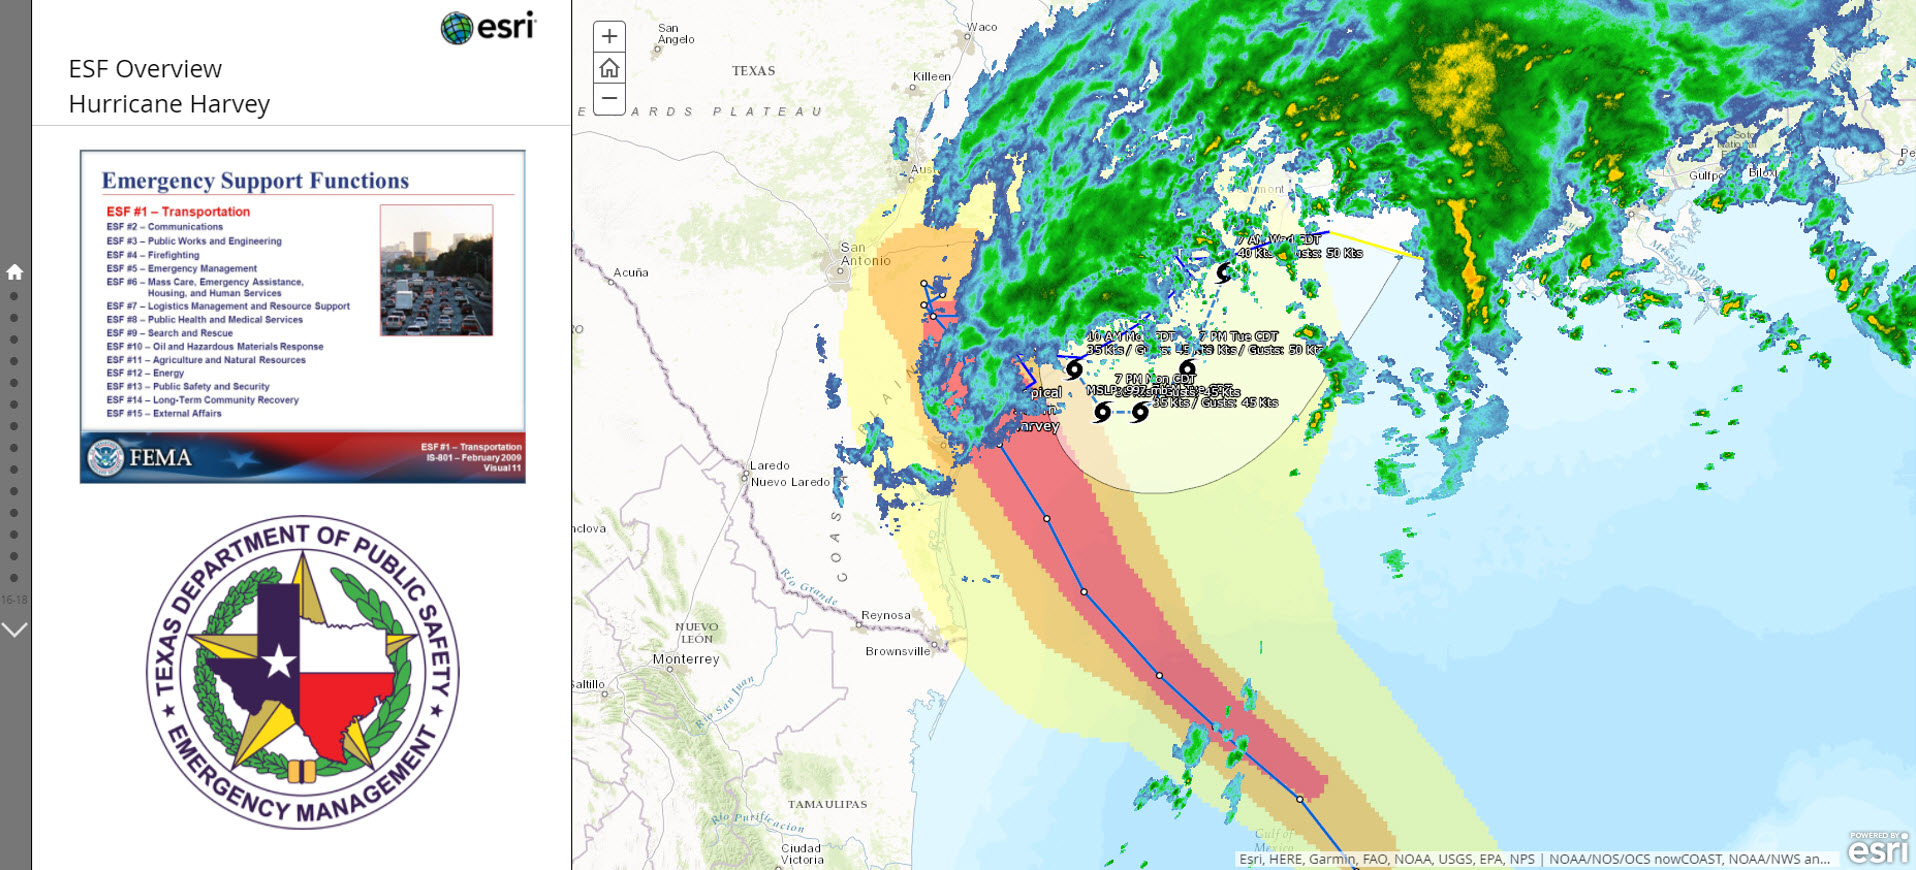
Story Map Journal
FEMA published several Story Map Journals that contained other maps and apps detailing specifics for both Harvey and Irma. Shown below is the FEMA Story Map Incident Journal for Irma, embedding many other apps.
Here's another example from the Texas Department of Public Safety used during Hurricane Harvey.
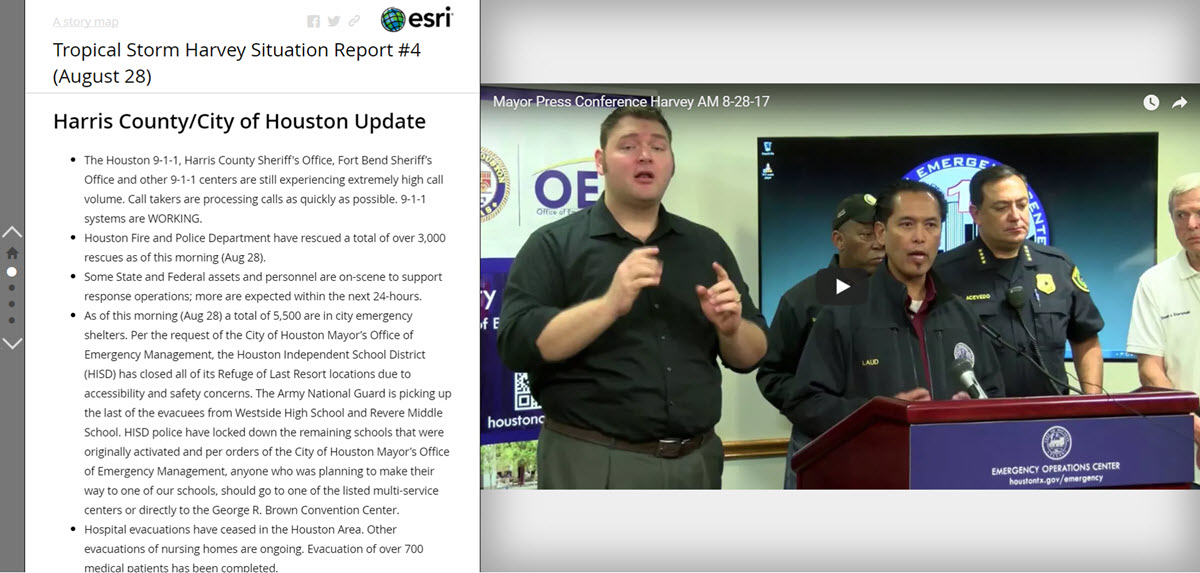
And a third example of a Situation Report created using a Story Map Journal from Harris County.
*
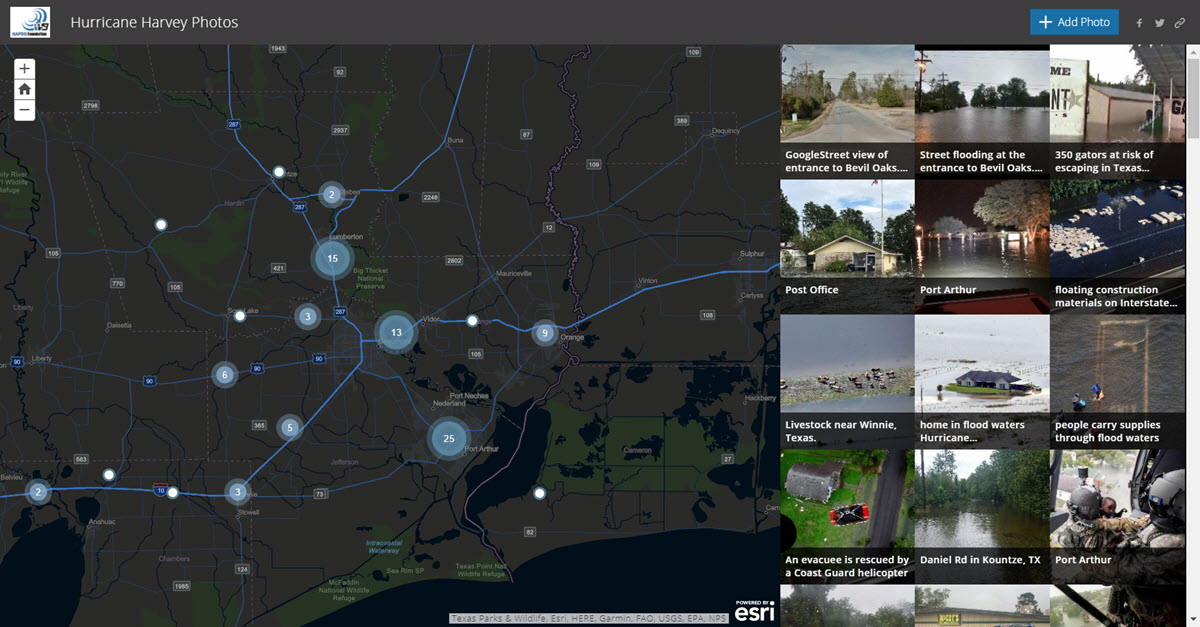
Story Map Crowdsource
Story Map Crowdsource was used to compile photographs from both Hurricanes Harvey and Irma to provide an idea and location of where damage had occurred, also providing a window onto what was happening on the ground. Shown below is the Crowdsource app for Hurricane Harvey from NAPSG.
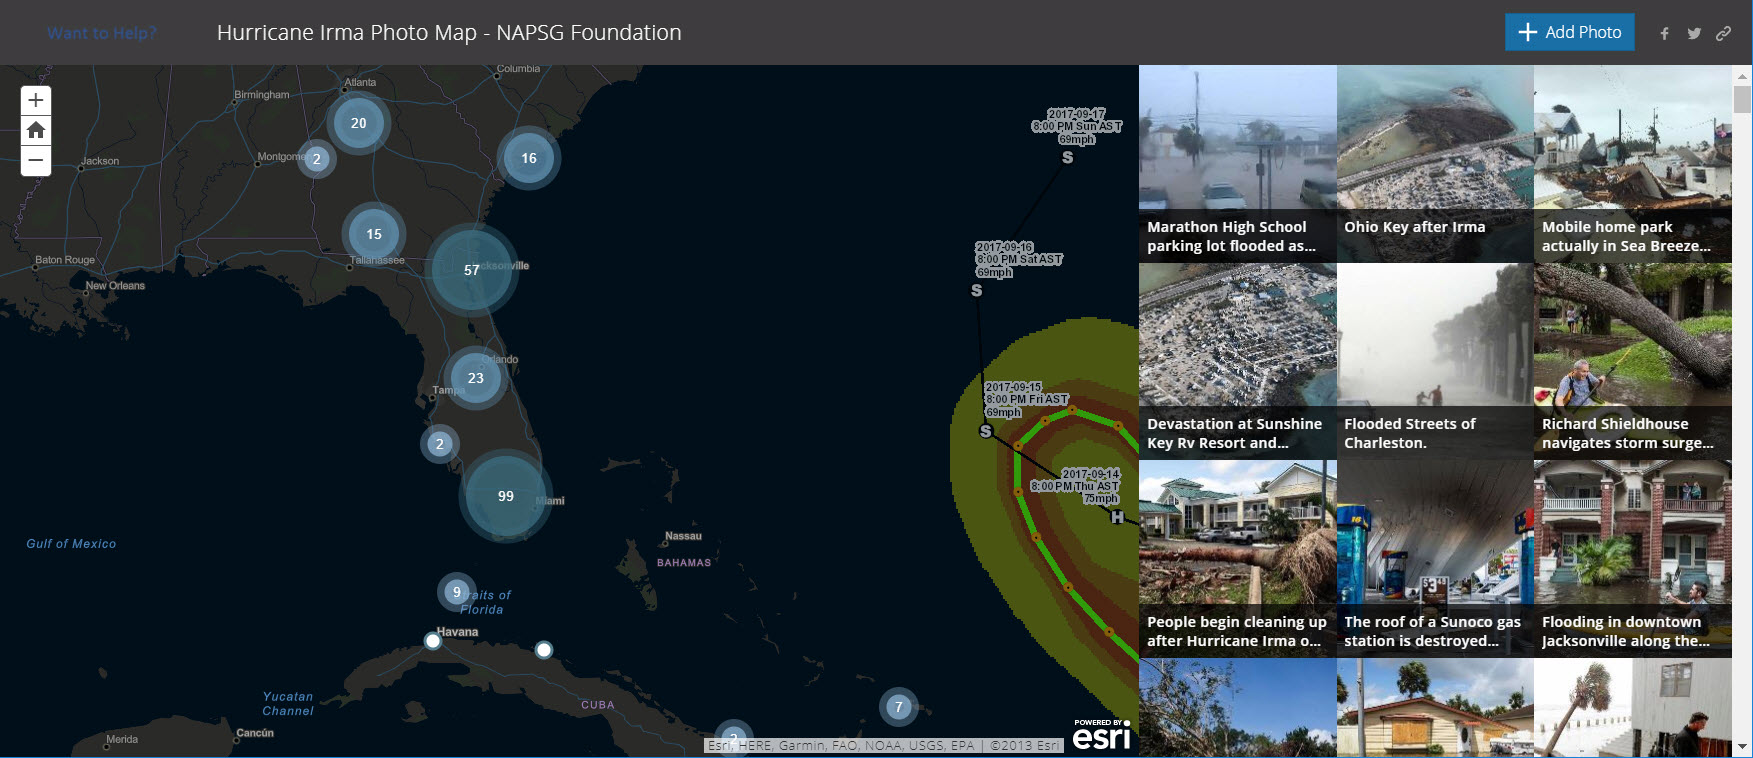
Shown below is the Crowdsource app for Hurricane Irma, also from NAPSG.
*
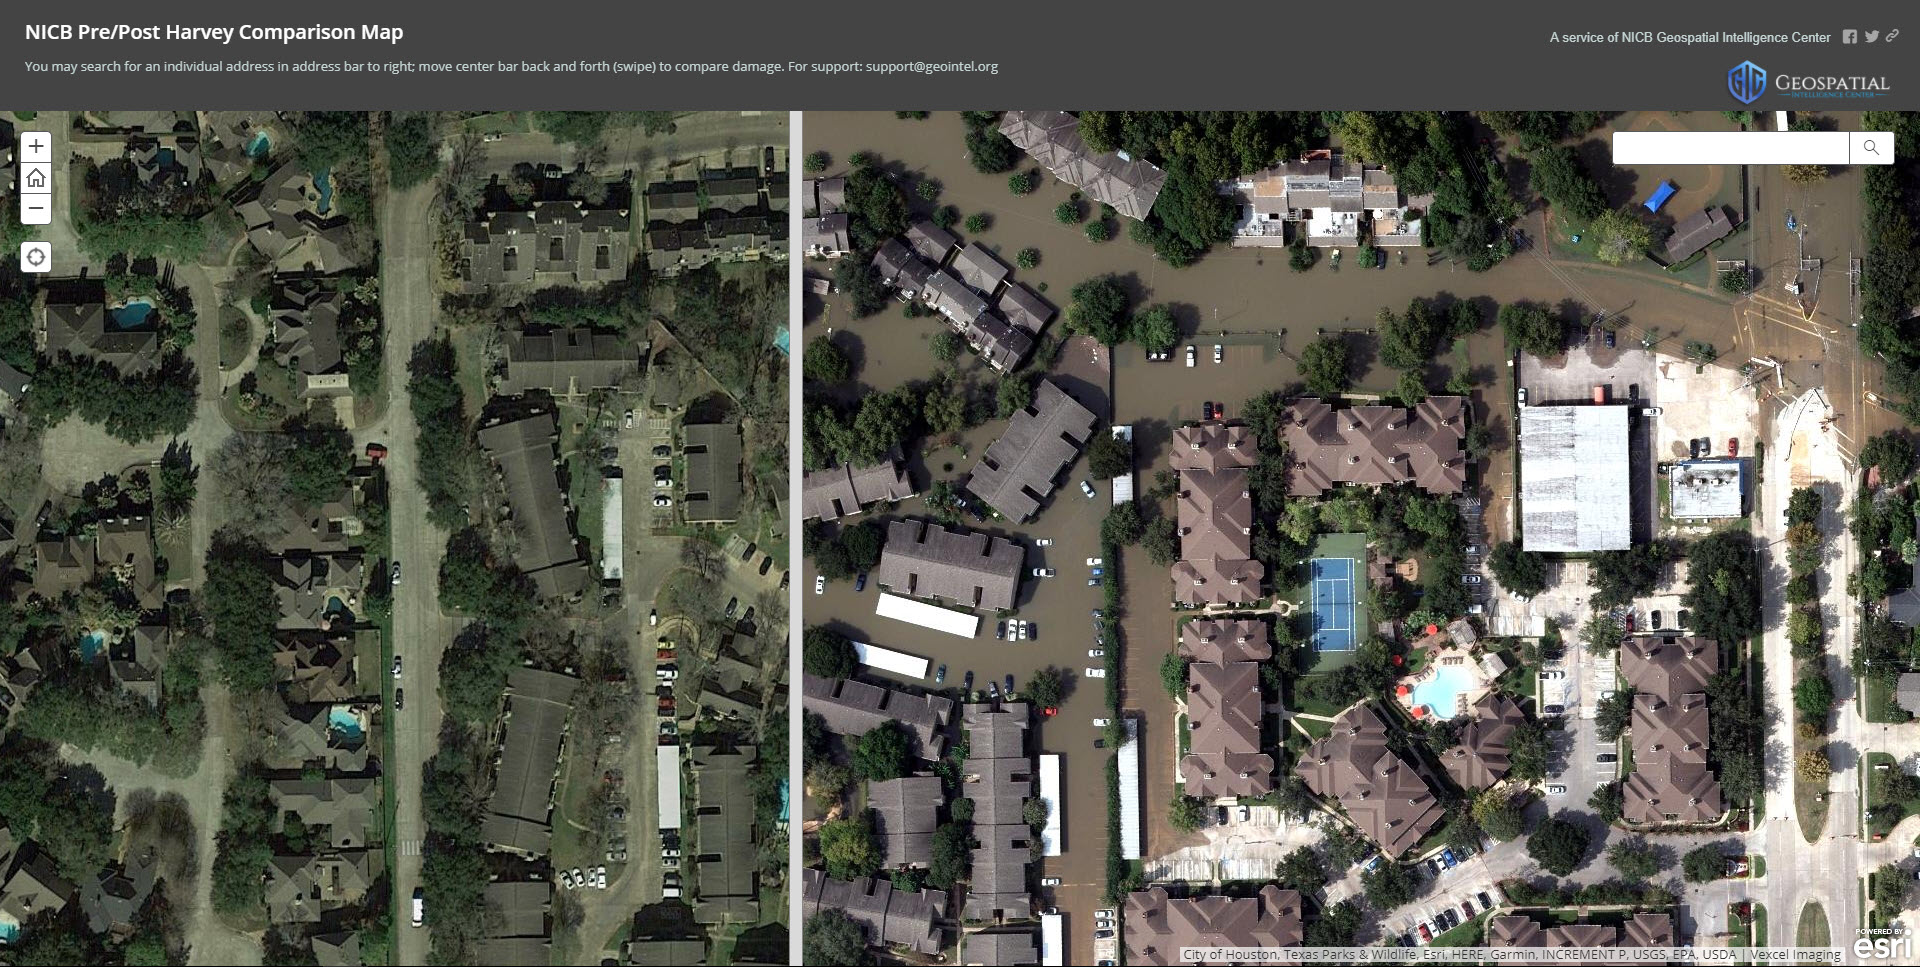
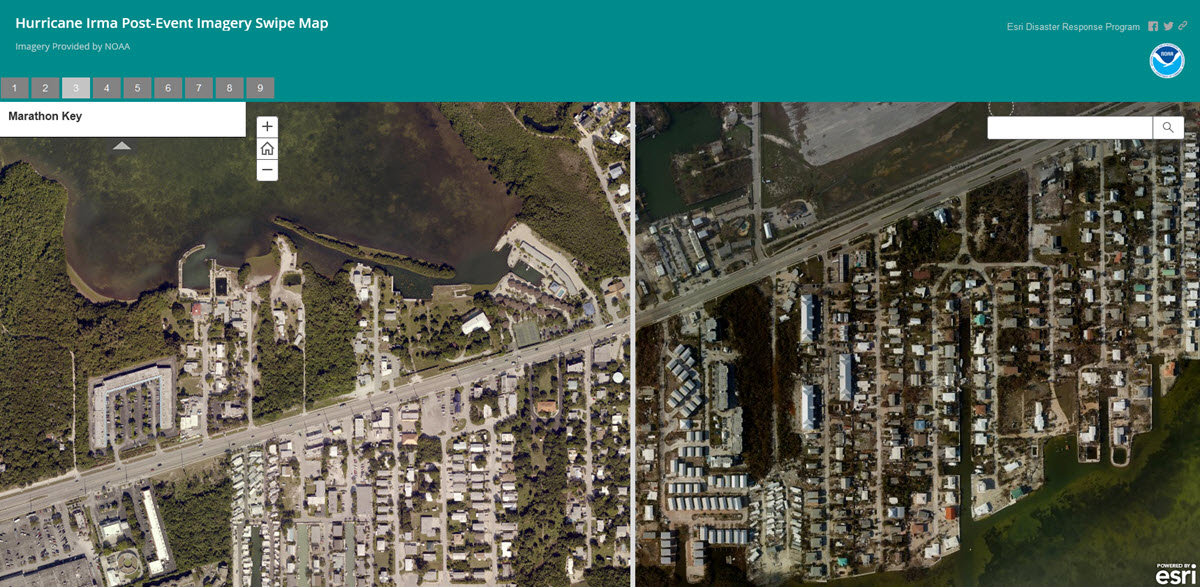
Story Map Swipe
Story Map Swipe is designed to enable you to compare multiple maps or layers, and is especially effective when viewing pre- and post- event imagery. Below is a Story Map Swipe from the NICB Geospatial Intelligence Center comparing before and after imagery for Hurricane Harvey. View application.
The Story Map Swipe below displays Hurricane Irma post-event imagery and includes bookmarks to specific locations, providing a before and after look using imagery from NOAA. View application.
*
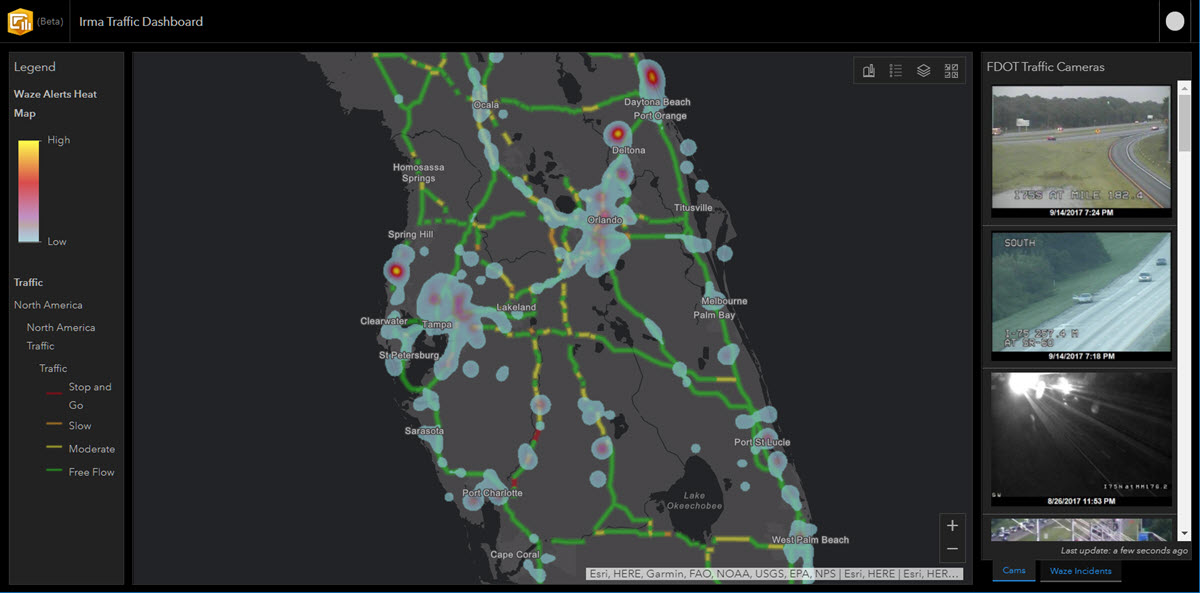
Operations Dashboard
Several Operations Dashboards were authored to provide an operational picture for keeping track of hurricane impacts and status. Dashboards use charts and statistics in addition to maps. This one showed current traffic (from the Living Atlas), Waze traffic alerts, and Houston TransStar live traffic cams.
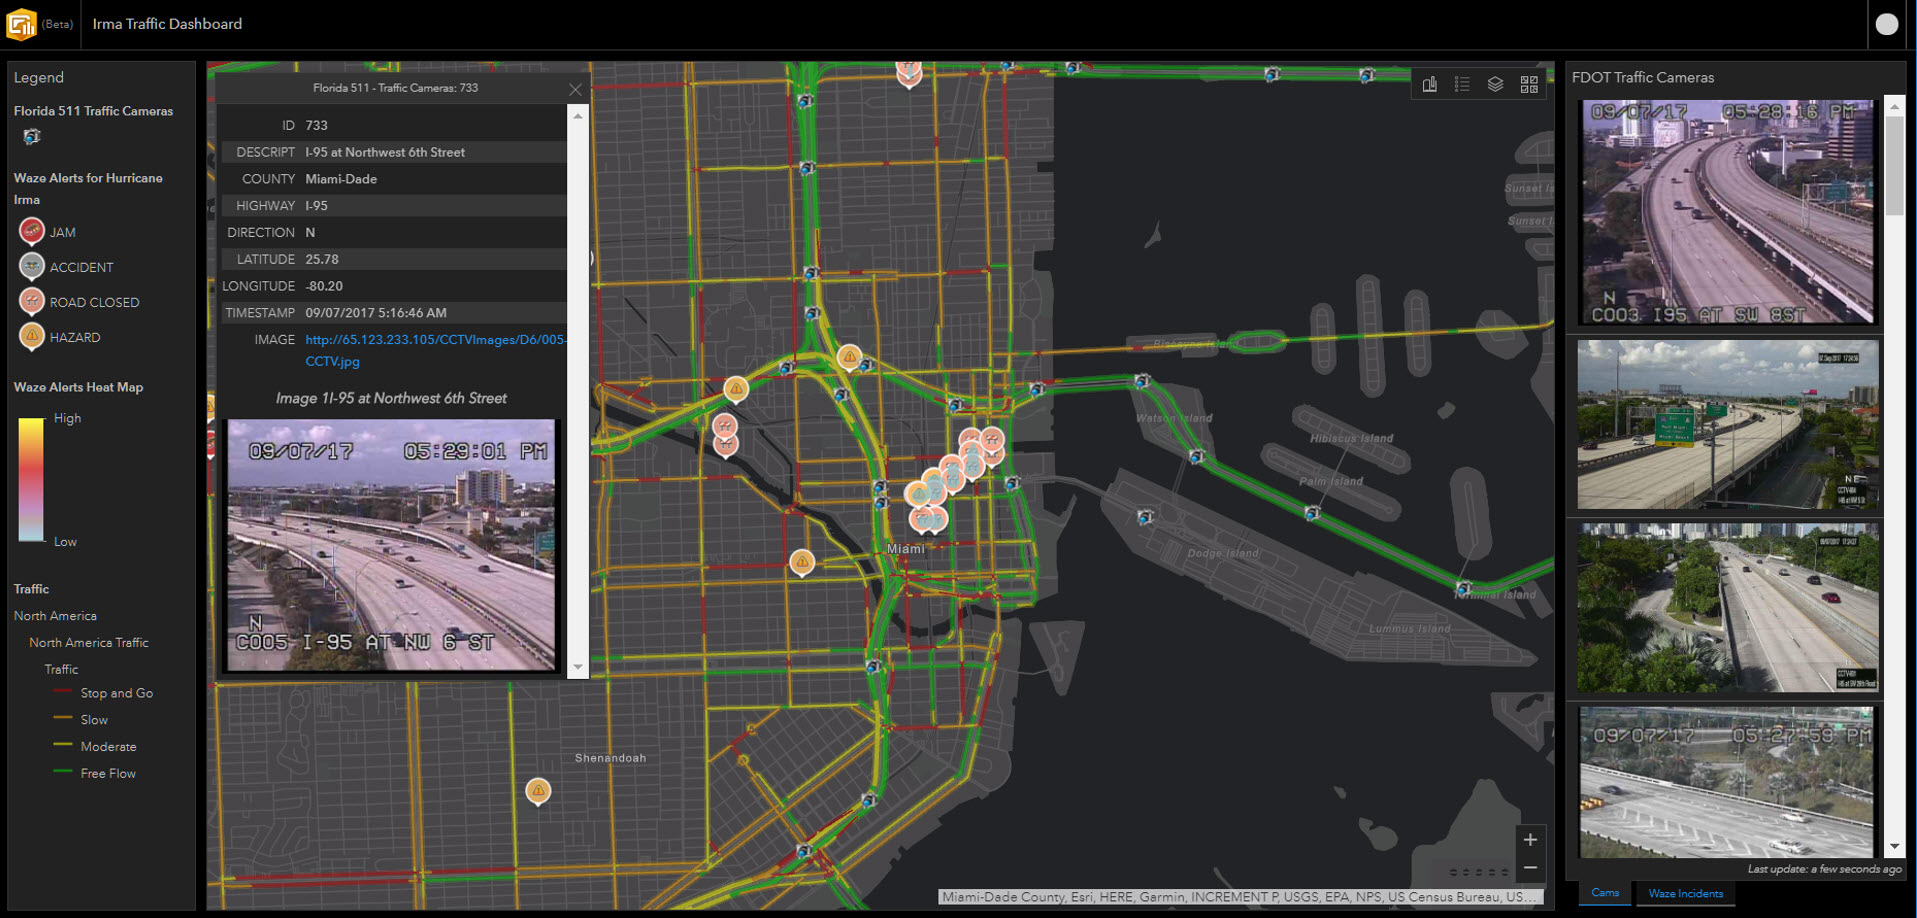
The one shown below for Hurricane Irma includes Florida DOT live traffic cams, Living Atlas current traffic conditions, Waze alerts, and a heat map of Waze alerts. View dashboard.
*
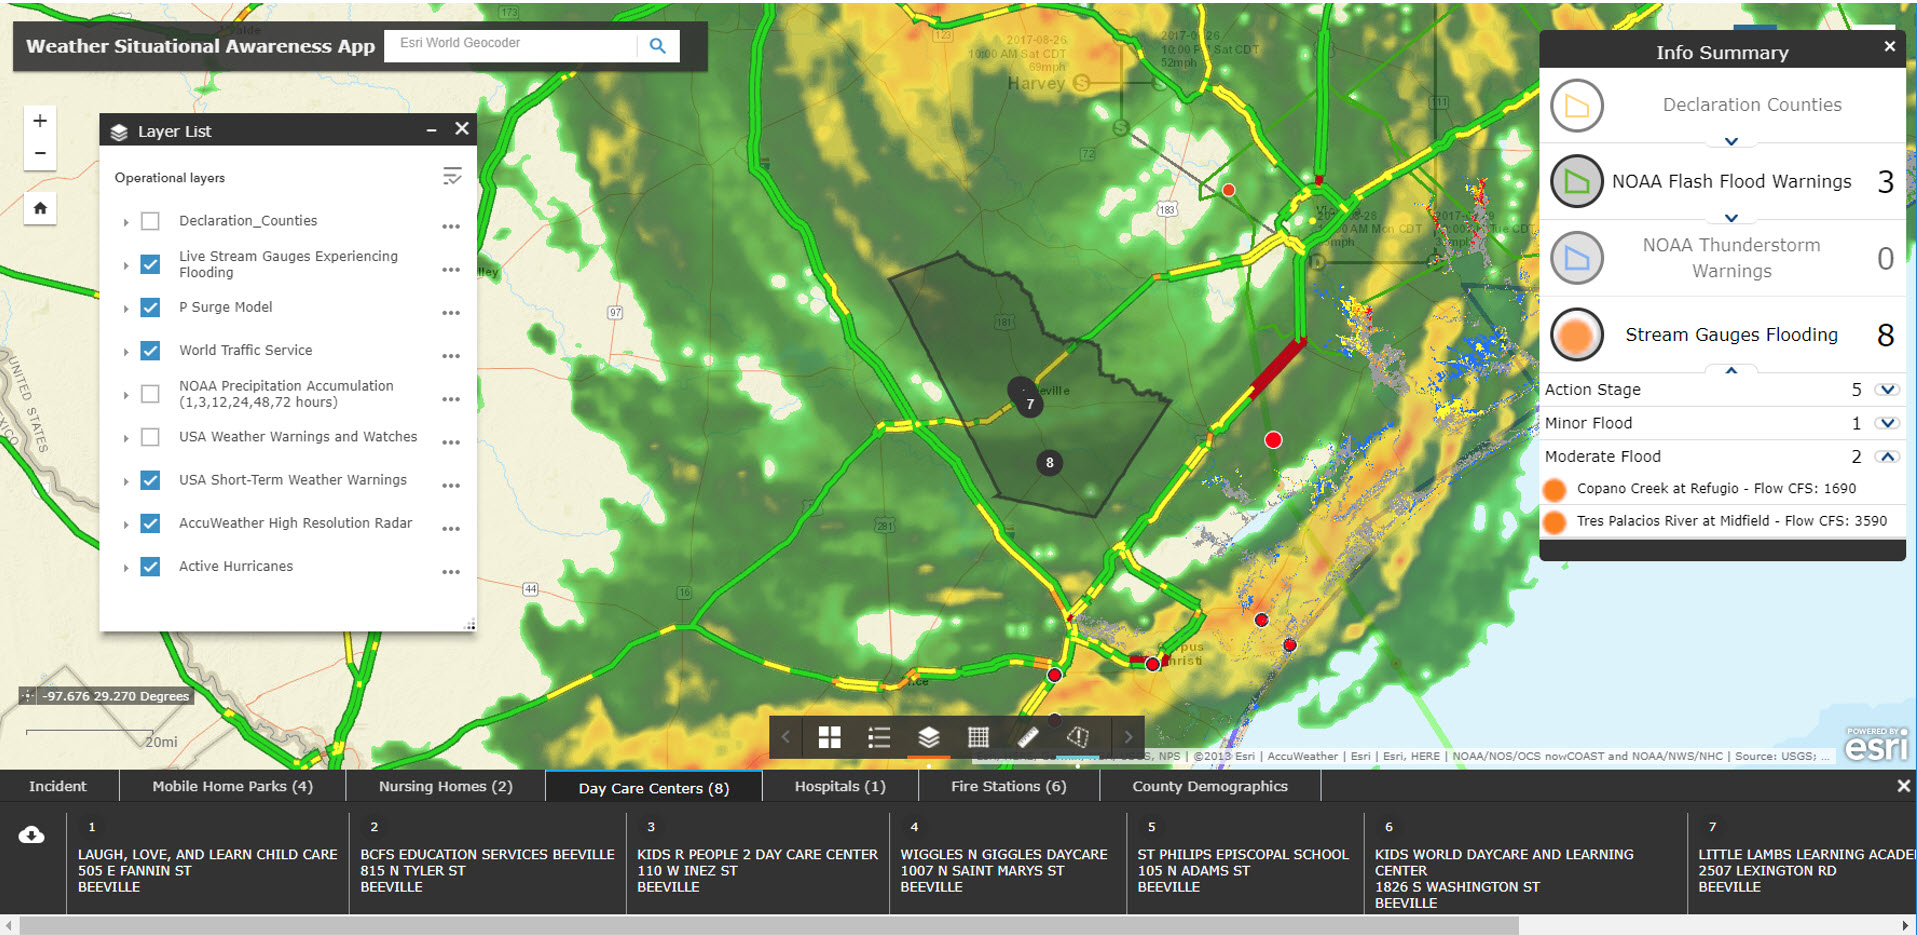
Web AppBuilder
Web AppBuilder offers a versatile way to build apps by assembling configurable widgets, some of which are ideal for use for situational awareness. Shown below is a an app built using Web AppBuilder that offered a perspective on current weather and its impacts during the Harvey response.
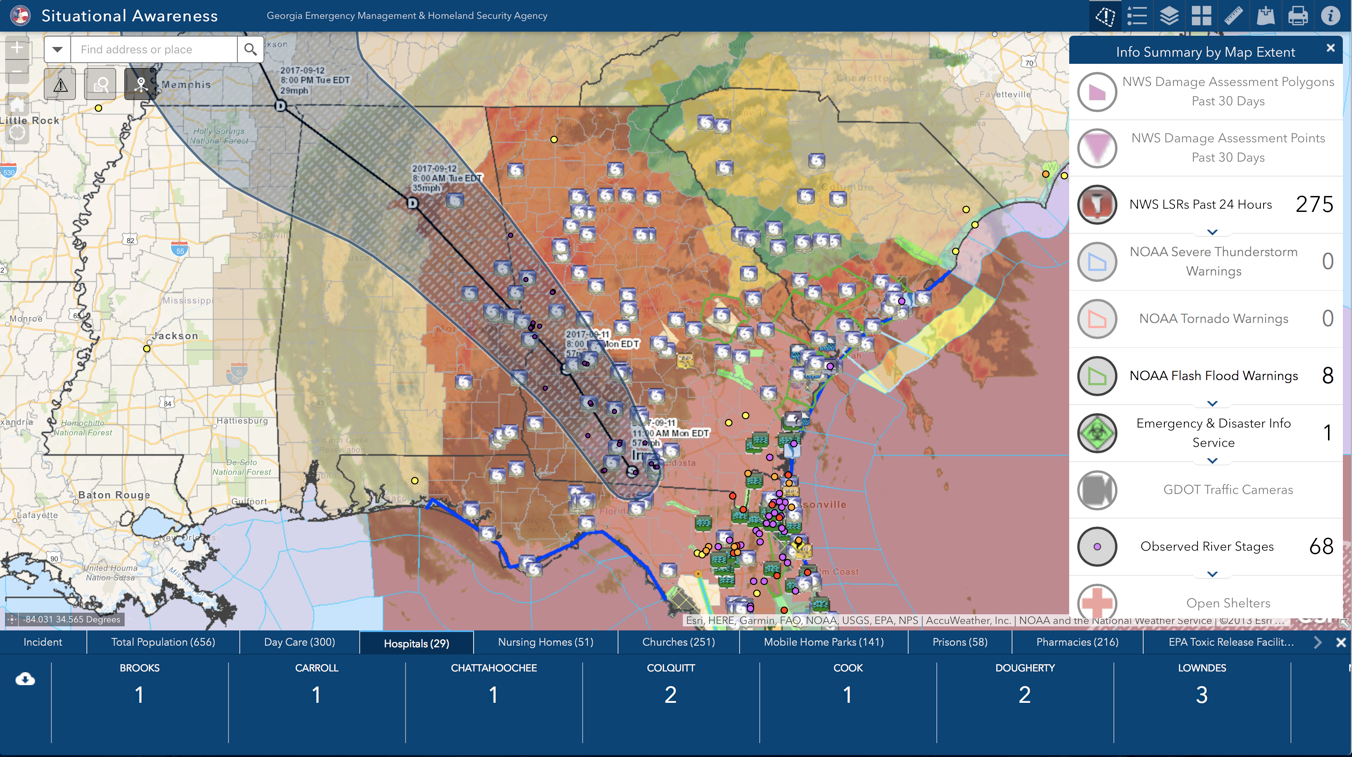
Below is a Web AppBuilder app from the Georgia Emergency Management & Homeland Security Agency, delivering impact summary data and incorporating a variety of real-time layers.
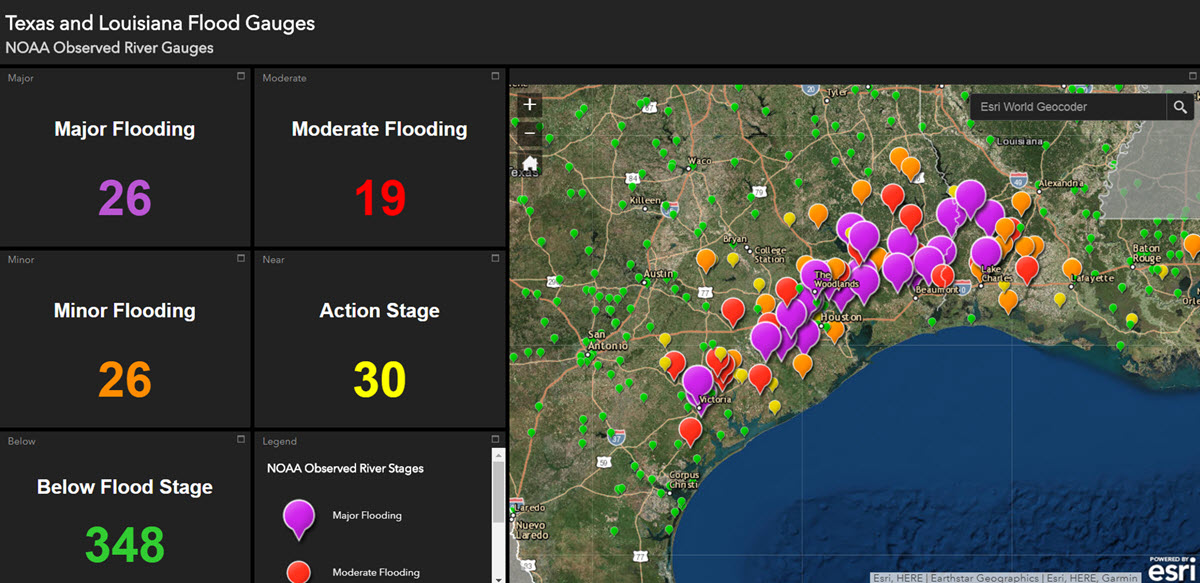
A dashboard created using new widgets now available in Web AppBuilder showing flood status.
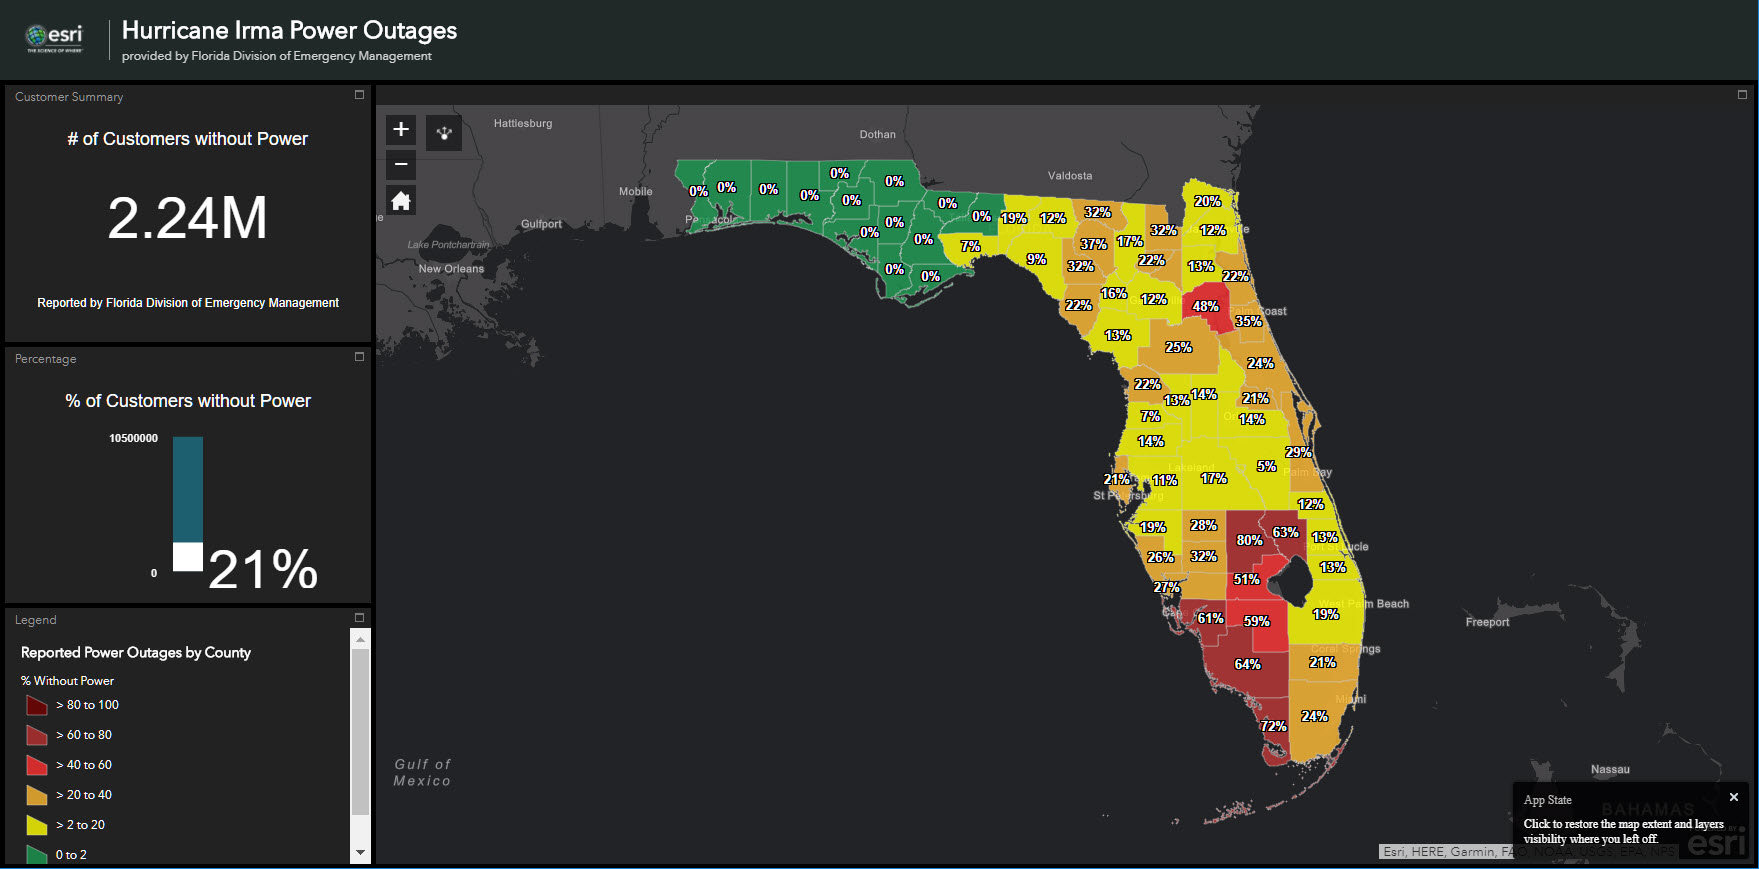
This one shows the power outages across Florida by county.
*
Open Data
Open Data is configured within your ArcGIS Organization, and can be used to share your authoritative open data in a variety of different formats so others can build upon and extend your work. Open datasets are connected to the source and are automatically updated.
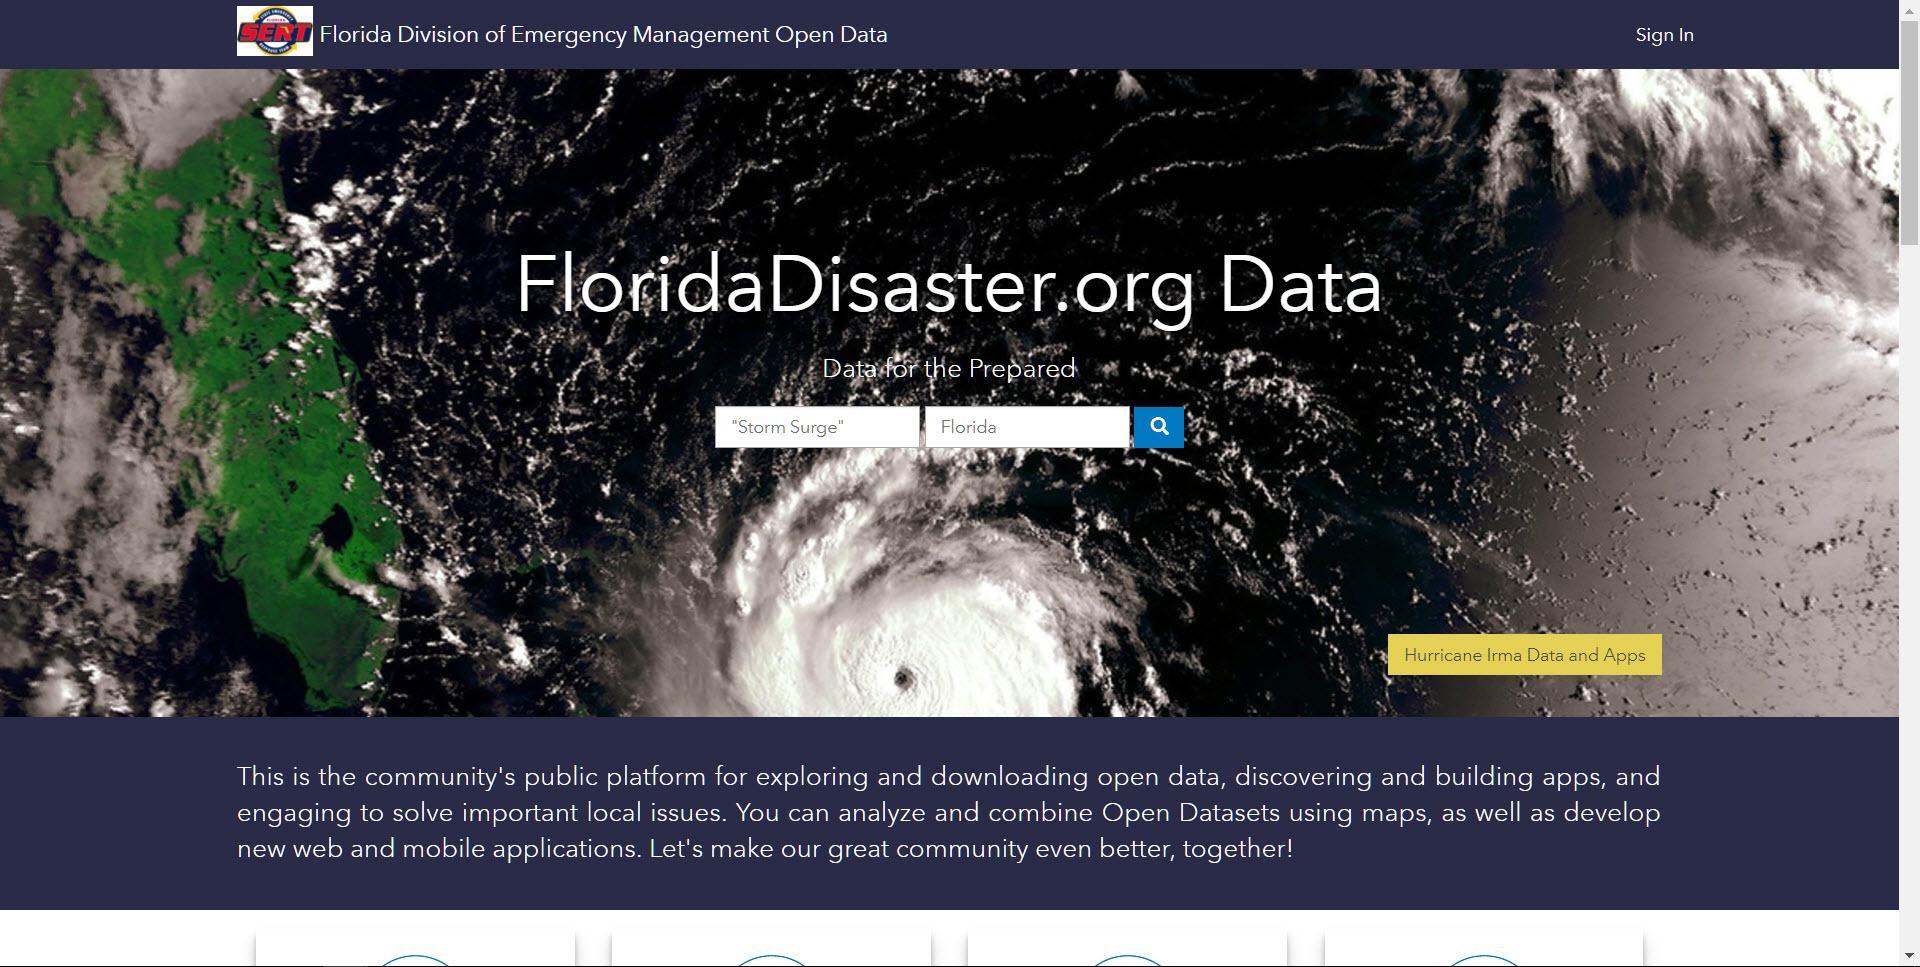
Several Open Data sites were leveraged during the response, shown below is one from the Florida Division of Emergency Management.
*
And more...
View more apps in the Hurricane Harvey apps group and the Hurricane Irma apps group compiled by the Esri Disaster Response Program team.
Story Maps, ArcGIS Configurable Apps, Disaster Response Program
You must be a registered user to add a comment. If you've already registered, sign in. Otherwise, register and sign in.