- Home
- :
- All Communities
- :
- Developers
- :
- Python
- :
- Python Blog
- :
- Patterns, sequences, occurrence and position
Patterns, sequences, occurrence and position
- Subscribe to RSS Feed
- Mark as New
- Mark as Read
- Bookmark
- Subscribe
- Printer Friendly Page
- Report Inappropriate Content
Patterns....
UPDATE : 2018-10-30
Added a demo at the end showing how to turn results into a structured array which can be used as a summary table in ArcGIS Pro.
Wonder where the .... it has rained for 10 days straight, the longest stretch since 1954 .... Do you picture some poor sod flipping through pages or reeling through spreadsheets. Unlikely. Many questions have to deal with 'sequences' or 'patterns' in the data.
I have put together a toolset and one of the tools in there allows you to identify a sequence and identify the value, the start and end locations in of the sequence, and the count/frequency of it. By dealing with a complete list of data, you can see whether the pattern is unique or has repeated over time.
The principle is fairly simple. Provide the list, determine the sequential difference of your choice, split the input and then summarize. For numbers, you can use numpy's diff function as shown below.
a = [1, 1, 2, 2, 3, 3, 3, 4, 4, 5, 5, 5, 5, 4, 4, 3, 3, 3, 2, 1]
seqs = np.split(a, np.where(np.diff(a) != stepsize)[0] + 1)
seqs
[array([1, 1]),
array([2, 2]),
array([3, 3, 3]),
array([4, 4]),
array([5, 5, 5, 5]),
array([4, 4]),
array([3, 3, 3]),
array([2]),
array([1])]For text data, the process is the same, but you compare each sequential element directly
a = np.array(['B', 'B', 'B', 'B', 'A', 'B', 'B', 'A', 'A', 'A', 'A', 'B', 'A', 'B', 'B'], dtype='<U5')
seqs = np.split(a, np.where(a[1:] != a[:-1])[0] + 1)
seqs
[array(['B', 'B', 'B', 'B'], dtype='<U5'),
array(['A'], dtype='<U5'),
array(['B', 'B'], dtype='<U5'),
array(['A', 'A', 'A', 'A'], dtype='<U5'),
array(['B'], dtype='<U5'),
array(['A'], dtype='<U5'),
array(['B', 'B'], dtype='<U5')]From that point on it is simply a matter of summarizing the result. That is the purpose of the rest of the tool.
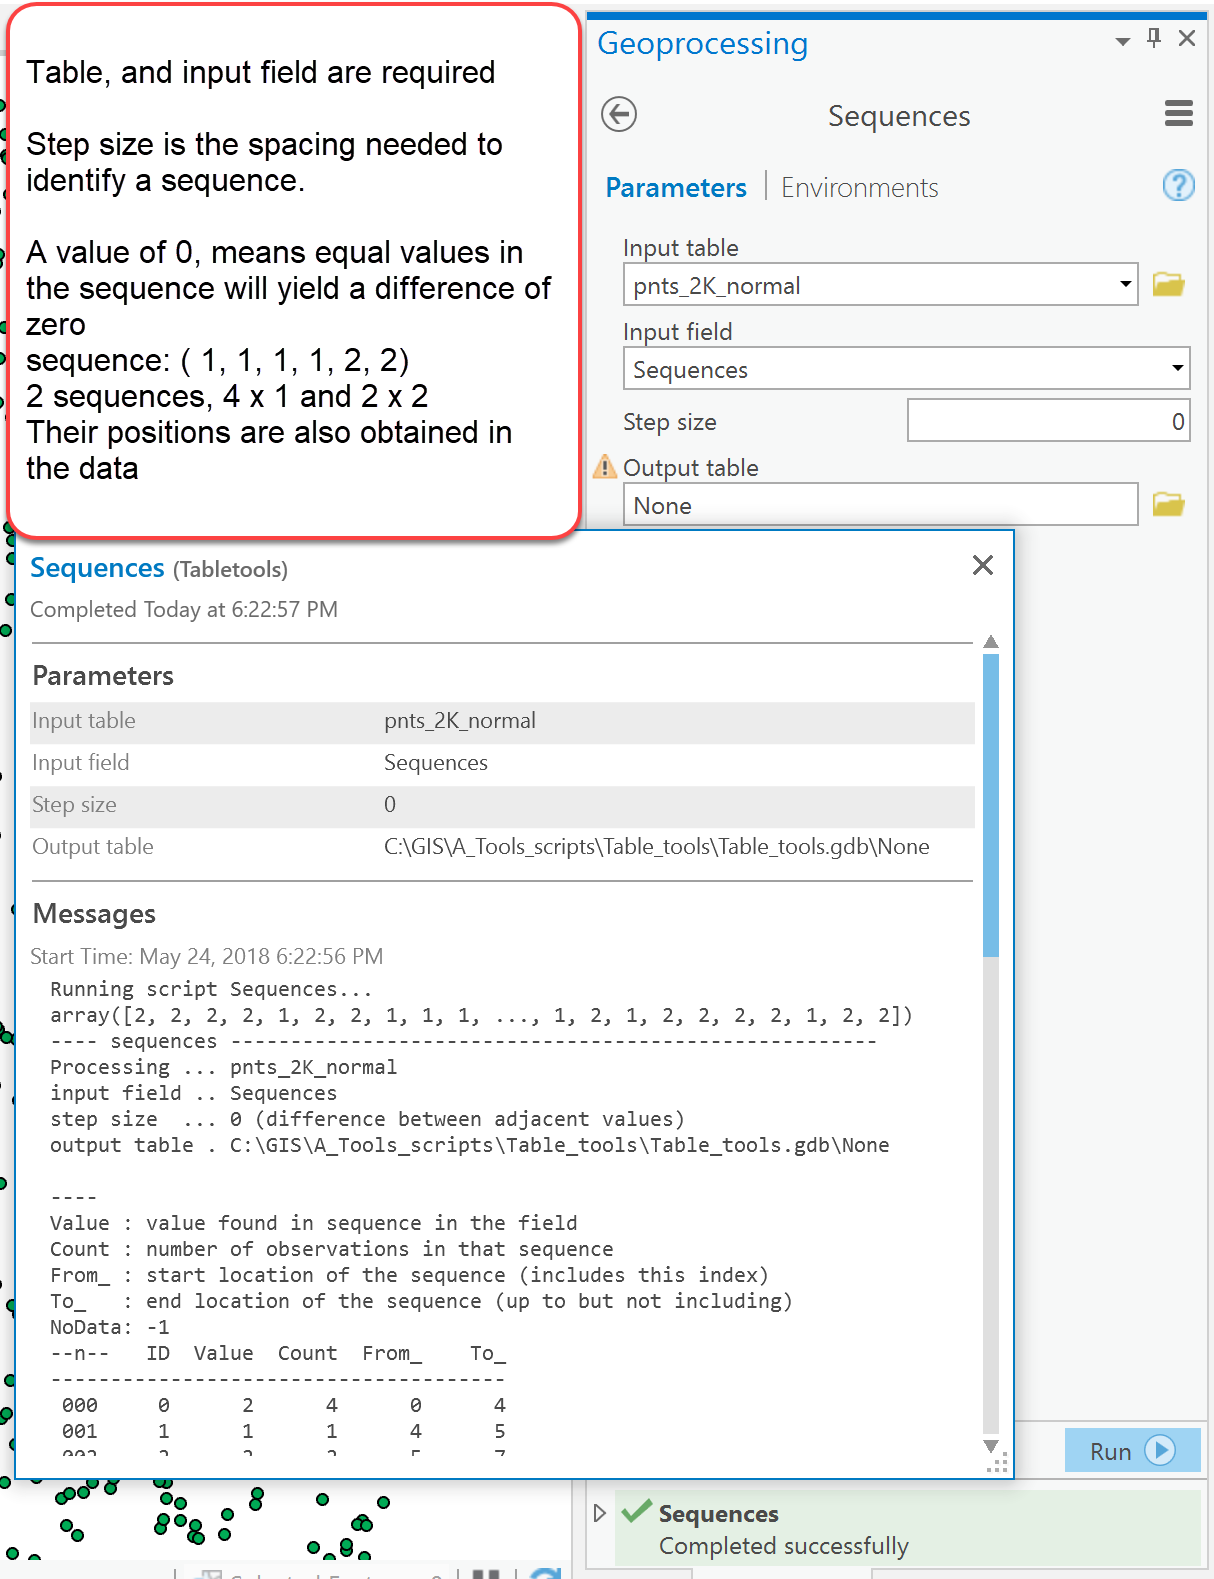
The dialog is fairly simple. Specify an input table and the field to query and a 'step size' which is the spacing between the values that you want to use to identify the sequence. The simplest case is to identify observations that are identical... that is, there sequential difference is zero.
 An optional output table can be created to permit further analysis.
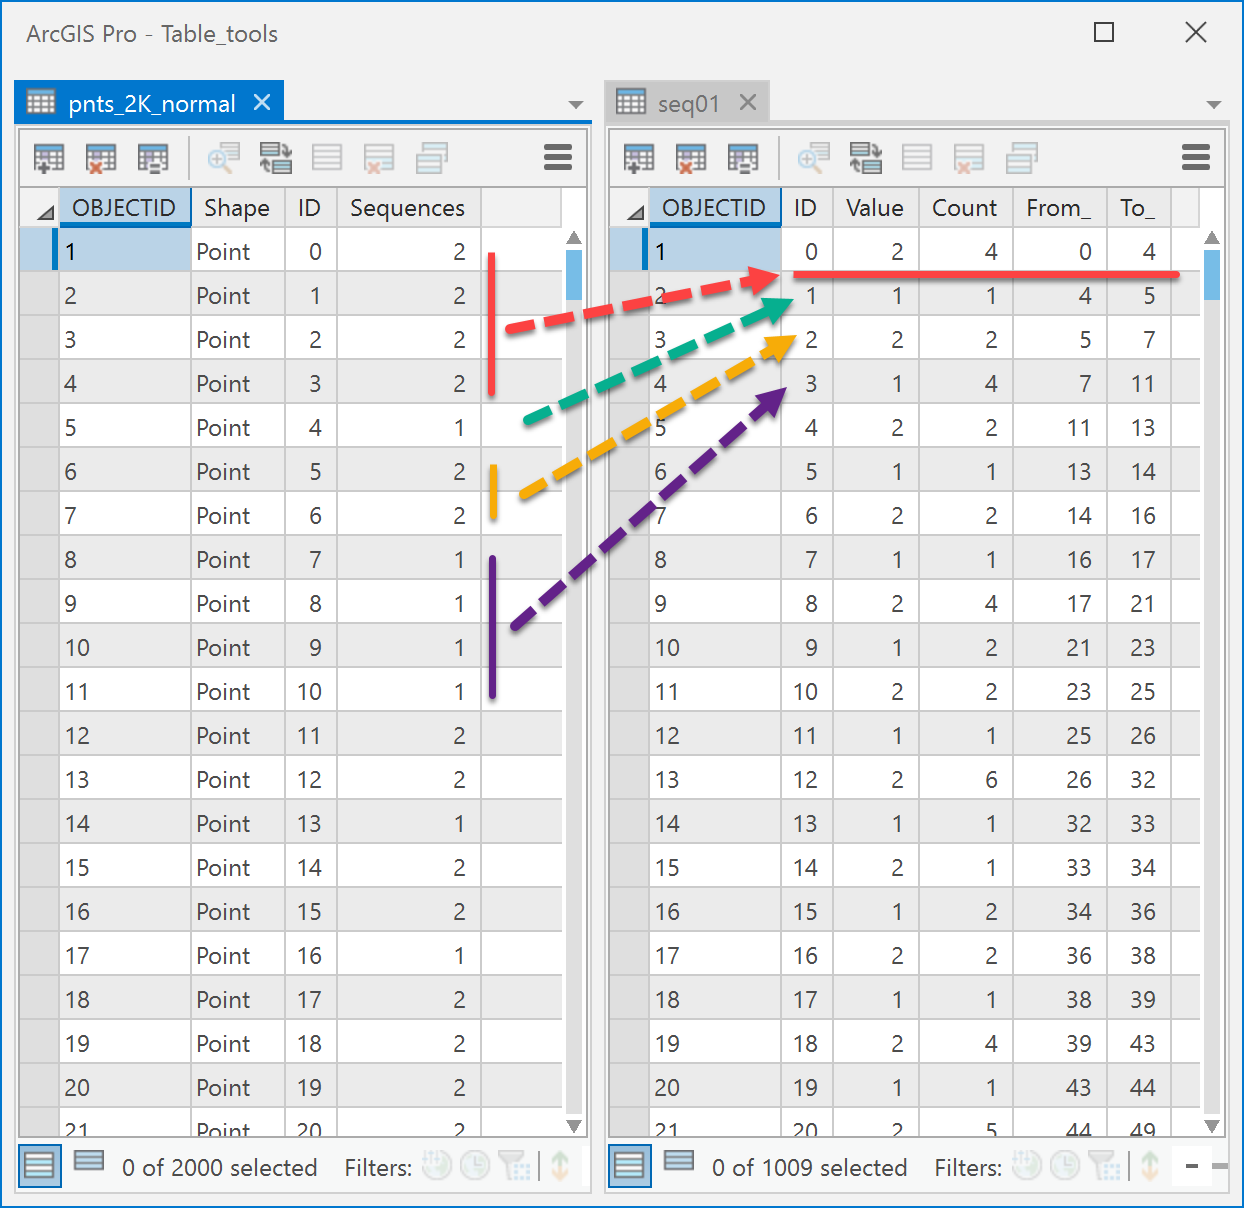
The input and output table for the Sequences field are shown to the right. The first sequence is four values of 2 beginning at ID number 0 and extending up to, but not including ID number 4.
Subsequent lines in the output table represent the different sequences. In this case, a sequence of 1 (value = 1) is followed by a sequence of 2 (value = 2) and another sequence of 4 (value = 1).
Some answers to questions.
1 What is the longest sequence of value = 1?
2 What is the median?
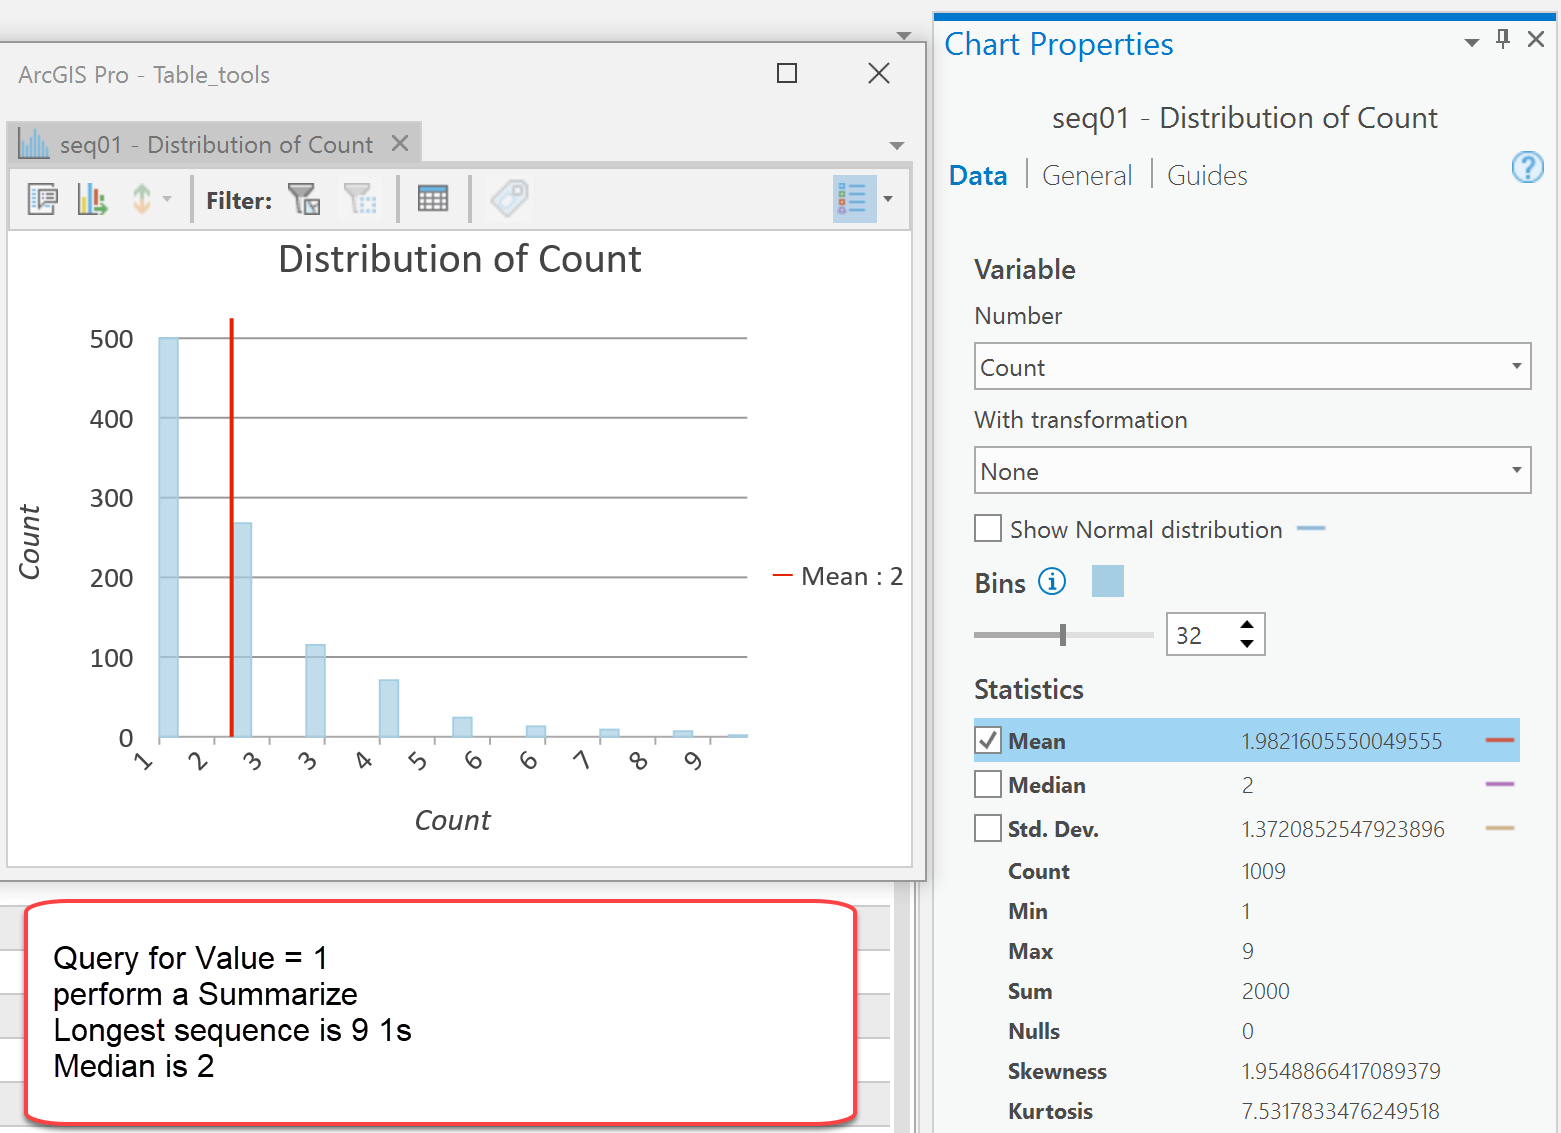
A simple Select By Attributes followed by a Statistics on the Count field and you are done.
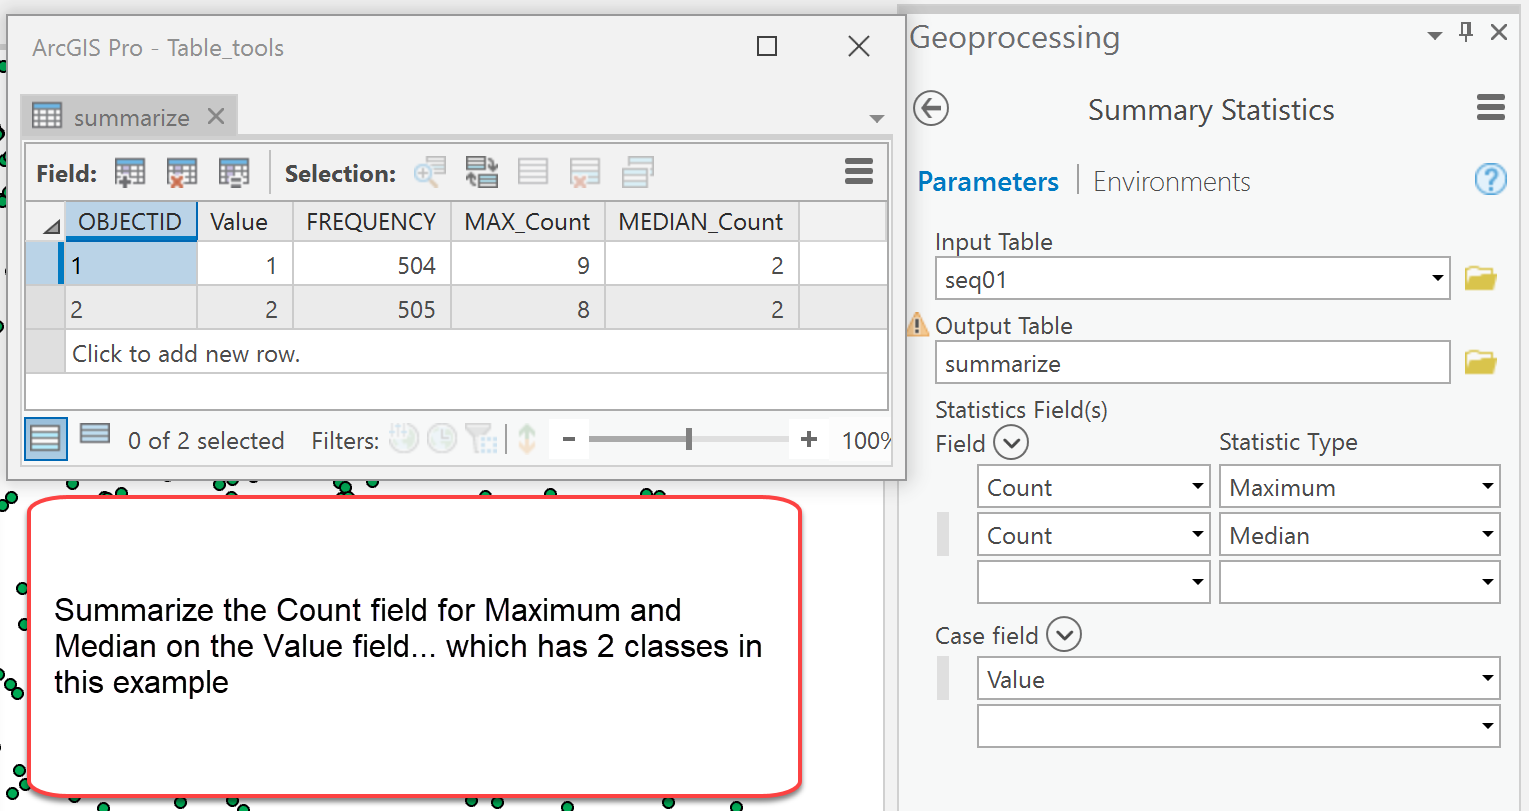
Alternately, you can Summarize on the Count field based on the Value field.
So examining sequences and patterns and their patterns and/or sequences come up a lot in analysis. Hope these tools will get you thinking.
NOTE.. the url to the toolset will appear
here....
when ArcGIS PRO Beta 2.2 is complete.
Tools will also be available to analysis sequences (or duplicates) for text data.
# ----- Producing a summary table as a structured array for use in Pro.
Start with our initial sequence from the beginning.
a = [1, 1, 2, 2, 3, 3, 3, 4, 4, 5, 5, 5, 5, 4, 4, 3, 3, 3, 2, 1]Take a seeming complex function... but it covers text and numbers, produces the counts for the sequence and does a positional from-to key....
Here are the results
prn_rec(sequences(a, stepsize=0))
id ID Value Count From_ To_
---------------------------------------
000 0 1 2 0 2
001 1 2 2 2 4
002 2 3 3 4 7
003 3 4 2 7 9
004 4 5 4 9 13
005 5 4 2 13 15
006 6 3 3 15 18
007 7 2 1 18 19
008 8 1 1 19 20Here is the 'sequences' code, sans the elaborate doc string.
def sequences(data, stepsize=0):
"""Return an array of sequence information denoted by stepsize
data : List/array of values in 1D
stepsize : Separation between the values.
If stepsize=0, sequences of equal values will be searched. If stepsize is 1,
then sequences incrementing by 1... etcetera. Stepsize can be both positive or
negative .... snip ....
"""
a = np.array(data)
a_dt = a.dtype.kind
dt = [('ID', '<i4'), ('Value', a.dtype.str), ('Count', '<i4'), ('From_', '<i4'),
('To_', '<i4')]
if a_dt in ('U', 'S'):
seqs = np.split(a, np.where(a[1:] != a[:-1])[0] + 1)
elif a_dt in ('i', 'f'):
seqs = np.split(a, np.where(np.diff(a) != stepsize)[0] + 1)
vals = [i[0] for i in seqs]
cnts = [len(i) for i in seqs]
seq_num = np.arange(len(cnts))
too = np.cumsum(cnts)
frum = np.zeros_like(too)
frum[1:] = too[:-1]
out = np.array(list(zip(seq_num, vals, cnts, frum, too)), dtype=dt)
return outThe prn_rec code will be available in the toolbox
If you don't mind a quick print like...
Array fields:
('ID', 'Value', 'Count', 'From_', 'To_')
[(0, 1, 2, 0, 2)
(1, 2, 2, 2, 4)
(2, 3, 3, 4, 7)
(3, 4, 2, 7, 9)
(4, 5, 4, 9, 13)
(5, 4, 2, 13, 15)
(6, 3, 3, 15, 18)
(7, 2, 1, 18, 19)
(8, 1, 1, 19, 20)]You can use quick_prn
def quick_prn(a, edgeitems=3, max_lines=25, wdth=100, decimals=2, prn=True):
"""Quick print and format a structured array
"""
wdth = min(len(str(a[0])), wdth) # try to force wrap
with np.printoptions(precision=decimals, edgeitems=edgeitems, threshold=max_lines, linewidth=wdth):
print("\nArray fields:\n{}\n{}".format(a.dtype.names, a))That's all for now.
You must be a registered user to add a comment. If you've already registered, sign in. Otherwise, register and sign in.