- Home
- :
- All Communities
- :
- Developers
- :
- Python
- :
- Python Blog
- :
- Viewing data from a different perspective
Viewing data from a different perspective
- Subscribe to RSS Feed
- Mark as New
- Mark as Read
- Bookmark
- Subscribe
- Printer Friendly Page
- Report Inappropriate Content
Data can be viewed in a variety of ways. This is example of how to view data. The examples I am going to use are arrays, but they can equally be replaced with small maps or other forms of data.
Picture this... a 3D list of data, like observations for 3 people. A simple printout of the data is pretty easy to digest if the set is small and the dimensions are few. Here are a couple of options. The first column (simple 3D array) is the standard presentation. The second column adds a bit more information and puts the dimension number in place of the blank row used previously, which would be handy if the list were long. The last column reshuffles the data so that each entry into the thrid dimension is a column block and it consolidates the number of rows needed to show data that are smaller in their columns with respect to the number of rows.
| Simple 3D array | 3D with a tad more information | 3D by rows each dimension as column |
|---|---|---|
The array... (a_3d) ... [[[ 7 2 11] [ 2 2 5] [ 7 0 1] [ 8 5 4] [ 8 8 6] [10 4 0]] [[ 7 13 5] [10 11 4] [11 0 2] [ 8 5 11] [ 7 2 0] [ 2 11 6]] [[ 9 6 9] [ 5 7 0] [12 9 6] [ 3 4 10] [ 9 14 1] [ 7 3 11]]] | de_line(a_3d) with extra info... array... shape (3, 6, 3) ndim 3 size 54 a[0]... [[[ 7 2 11] [ 2 2 5] [ 7 0 1] [ 8 5 4] [ 8 8 6] [10 4 0]] a[1].... [[ 7 13 5] [10 11 4] [11 0 2] [ 8 5 11] [ 7 2 0] [ 2 11 6]] a[2].... [[ 9 6 9] [ 5 7 0] [12 9 6] [ 3 4 10] [ 9 14 1] [ 7 3 11]]] | to_row(a_3d) Array... 3D r c shape: (3, 6, 3) size: 54 a[0]...... a[1]...... a[2]...... [ 7 2 11] [ 7 13 5] [ 9 6 9] [ 2 2 5] [10 11 4] [ 5 7 0] [ 7 0 1] [11 0 2] [12 9 6] [ 8 5 4] [ 8 5 11] [ 3 4 10] [ 8 8 6] [ 7 2 0] [ 9 14 1] [10 4 0] [ 2 11 6] [ 7 3 11] |
The tabular data shown in the last column can be presented in graphical form if the arrays are fairly simple.
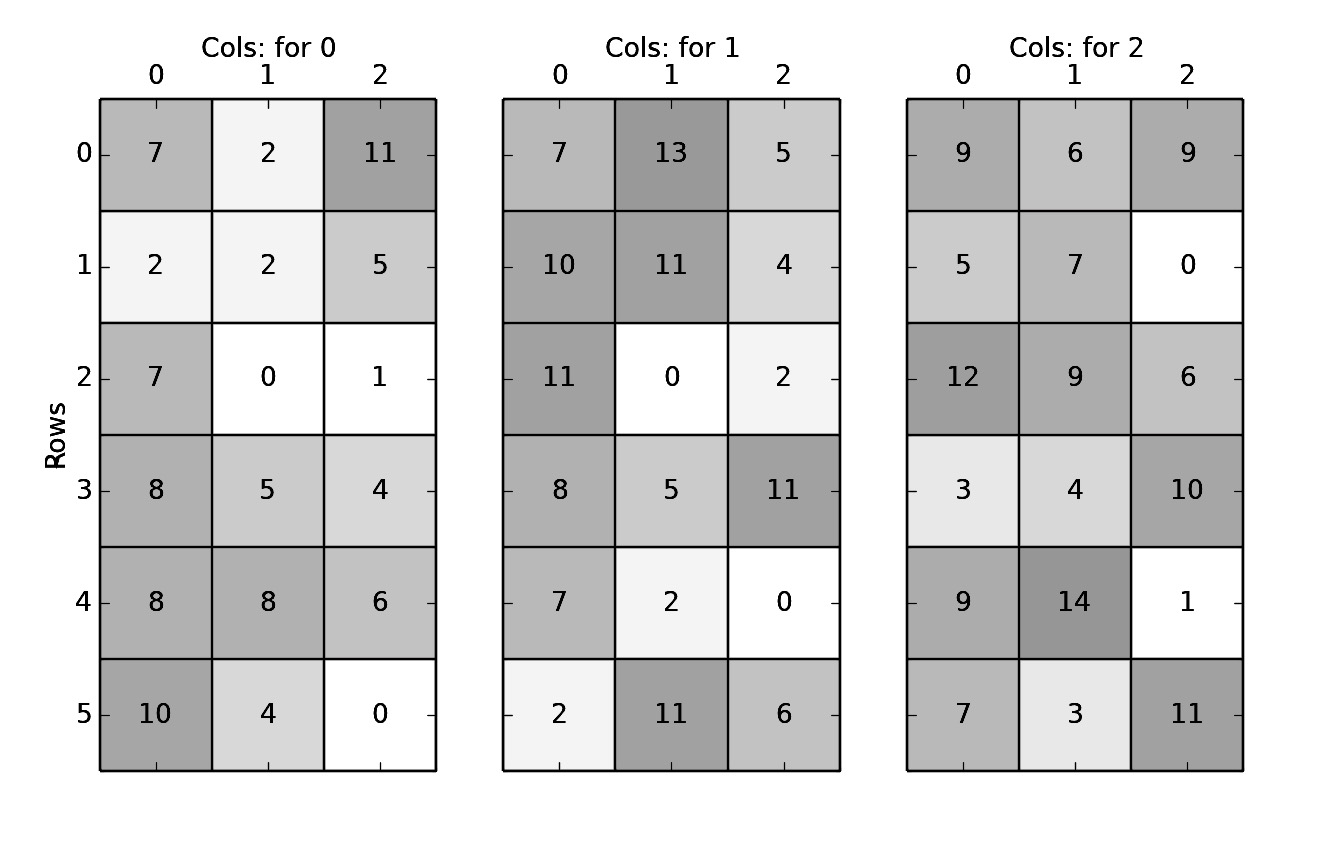
Color would be cool, with or without labels, or you can skip the fill and simply use the labels.
Of course this can be applied to higher or lower dimensions as in the case of the 4D array below, which consists of 5 3D arrays.
| 4D shaping |
|---|
Array... 4D shape: (5, 3, 6, 3) size: 270 3D subarrays: 5 Array... 3D r c shape: (3, 6, 3) size: 54 a[0]...... a[1]...... a[2]...... [ 7 2 11] [ 7 13 5] [ 9 6 9] [ 2 2 5] [10 11 4] [ 5 7 0] [ 7 0 1] [11 0 2] [12 9 6] [ 8 5 4] [ 8 5 11] [ 3 4 10] [ 8 8 6] [ 7 2 0] [ 9 14 1] [10 4 0] [ 2 11 6] [ 7 3 11] Array... 3D r c shape: (3, 6, 3) size: 54 a[0]...... a[1]...... a[2]...... ... SNIP ... [16 10 6] [ 8 17 12] [13 9 17] Array... 3D r c</p> shape: (3, 6, 3) size: 54 a[0]...... a[1]...... a[2]...... [15 10 19] [15 21 13] [17 14 17] [10 10 13] [18 19 12] [13 15 8] [15 8 9] [19 8 10] [20 17 14] [16 13 12] [16 13 19] [11 12 18] [16 16 14] [15 10 8] [17 22 9] [18 12 8] [10 19 14] [15 11 19] |
I suppose it is a matter of perspective which format you prefer. Comments welcome prior to posting my code in case people have views they would like to see.
You must be a registered user to add a comment. If you've already registered, sign in. Otherwise, register and sign in.