Turn on suggestions
Auto-suggest helps you quickly narrow down your search results by suggesting possible matches as you type.
Cancel
- Home
- :
- All Communities
- :
- Products
- :
- ArcGIS StoryMaps
- :
- Classic Esri Story Maps Questions
- :
- Re: How do you add a chart or table in ArcGIS Stor...
Options
- Subscribe to RSS Feed
- Mark Topic as New
- Mark Topic as Read
- Float this Topic for Current User
- Bookmark
- Subscribe
- Mute
- Printer Friendly Page
How do you add a chart or table in ArcGIS Story Maps?
Subscribe
8276
2
01-23-2018 03:32 PM
01-23-2018
03:32 PM
- Mark as New
- Bookmark
- Subscribe
- Mute
- Subscribe to RSS Feed
- Permalink
- Report Inappropriate Content
For example on Google Docs, you can 'insert a table' like this one below! This is exactly what I need but I do not know how to insert something like this on the side panel writing of ArcGIS Story Maps??
| Header 1 | Header 2 |
|---|---|
2 Replies
01-24-2018
03:06 AM
- Mark as New
- Bookmark
- Subscribe
- Mute
- Subscribe to RSS Feed
- Permalink
- Report Inappropriate Content
Hi,
What story map app are you using? Apps | Story Maps
A number of the apps support working with HTML so it's possible to add a table using any of the tags mentioned here: https://developerscorner.storymaps.arcgis.com/using-custom-html-in-map-journal-70913cfff66e
Here's some basic HTML table help too: HTML Tables
To replicate the above table in Story Map Journal for example, you'd insert the following code into the the Side Panel by clicking this button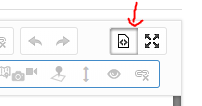 :
:
<html>
<head>
<style>
table, th, td {
 border: 1px solid black;
 border-collapse: collapse;
}
th, td {
 padding: 5px;
 text-align: left;
}
table#t01 {
 width: 100%;
 background-color: #f1f1c1;
}
</style>
</head>
<body>

<table style="width:100%">
 <tr>
    <th>Header 1</th>
    <th>Header 2</th>
 </tr>
 <tr>
    <td></td>
    <td></td>
 </tr>
 <tr>
    <td></td>
    <td></td>
 </tr>
</table>
<br>

Otherwise you could take a screenshot of the table from Google Docs and load it as an Image into the Story Map.

Carmel
09-09-2019
12:10 PM
- Mark as New
- Bookmark
- Subscribe
- Mute
- Subscribe to RSS Feed
- Permalink
- Report Inappropriate Content
Thanks Carmel
Great tip! Here's what we did with it.
Ned Cake
TLCGIS