- Home
- :
- All Communities
- :
- Products
- :
- ArcGIS Spatial Analyst
- :
- ArcGIS Spatial Analyst Questions
- :
- raster calculator division. erroneous range of va...
- Subscribe to RSS Feed
- Mark Topic as New
- Mark Topic as Read
- Float this Topic for Current User
- Bookmark
- Subscribe
- Mute
- Printer Friendly Page
raster calculator division. erroneous range of values?
- Mark as New
- Bookmark
- Subscribe
- Mute
- Subscribe to RSS Feed
- Permalink
- Report Inappropriate Content
Raster division error?
Need help with raster calculator division
Raster A (CaptureA.PNG) and B (CaptureB.PNG) are both 32 bit. floating point
I wanted to divide A by B but the range of the values (CaptureAB.PNG) is erroneous (is it?)
Am i missing something here?
Thanks for you feedback.
- Mark as New
- Bookmark
- Subscribe
- Mute
- Subscribe to RSS Feed
- Permalink
- Report Inappropriate Content
np.finfo(np.float32).min
-3.4028235e+38
numerator = np.arange(6000, 6300, 100, dtype=np.float32)
denominator = np.array([1e-12, 1e-11, 1e-10])
numerator/denominator
array([6.0e+15, 6.1e+14, 6.2e+13])Not out of range. It probably means that you have some values in the denominator that are extremely small.
To test, you need to report your minimum value for the denominator
- Mark as New
- Bookmark
- Subscribe
- Mute
- Subscribe to RSS Feed
- Permalink
- Report Inappropriate Content
Thanks for the feedback.
I attached the symbology of the rasters.
Jenks. 9 classes. Indeed, the denominator (KernelID_B) has extremely small values.
The quotient (KernelID_A/B) only has 3 classes.
Thanks a lot.
- Mark as New
- Bookmark
- Subscribe
- Mute
- Subscribe to RSS Feed
- Permalink
- Report Inappropriate Content
Eric
Right-click on each raster, select Properties... Source, Raster Information, Band Metadata, then Statistics....
What is the min and max?
If you want to use symbology, you probably need to look at the data histograms to see where each dataset has values.
The range is possible given the ranges of values between the two
- Mark as New
- Bookmark
- Subscribe
- Mute
- Subscribe to RSS Feed
- Permalink
- Report Inappropriate Content
Hi Dan
Thank you very much. Really appreciate the help
KernelID A
min 0
max 6298.732......
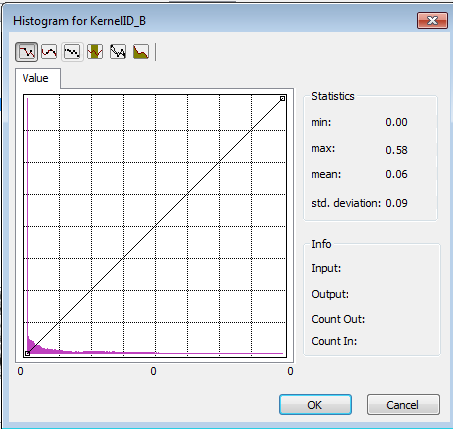
KernelID B
min 0
max 0.579932.......
KernelID A/B
min 0
max 299913969664
I'm more interested on dividing Kernel A by Kernel B. then symbolize the the "Quotient"
Am i doing it wrong
Attched are the histograms
- Mark as New
- Bookmark
- Subscribe
- Mute
- Subscribe to RSS Feed
- Permalink
- Report Inappropriate Content
Eric...
Huge number of zeros in both cases. I hope 0 isn't nodata, if so, these should be dealt with since they are throwing off the histograms, and if they are really nodata values, then that might explain why you haven't had any divide by 0 errors (?).
But in any event, you still have ranges in the histogram that can give rise to the values you found, so I don't things are mathematically going wrong.
Perhaps they aren't what you expect, which mean you should address the questions surrounding the co-location that gives rise to the various values.
Maybe it is time for a map or two and as for the ratio of the variables giving only 3 classes.... change it to something other than jenks so you get a real idea of what the values are in a different classification scheme.