- Home
- :
- All Communities
- :
- Products
- :
- ArcGIS Spatial Analyst
- :
- ArcGIS Spatial Analyst Questions
- :
- Re: Point density tool outputs-units
- Subscribe to RSS Feed
- Mark Topic as New
- Mark Topic as Read
- Float this Topic for Current User
- Bookmark
- Subscribe
- Mute
- Printer Friendly Page
Point density tool outputs-units
- Mark as New
- Bookmark
- Subscribe
- Mute
- Subscribe to RSS Feed
- Permalink
- Report Inappropriate Content
Hello all,
I am trying to examine point density of where tropical cyclones form. My output cell size is 100 km^2 (I am looking at the Central Pacific) and my outputs in the legend come out as values such as 2.5.
Does this mean there are 2.5 storms that form within each 100 km2 grid cell? I'm just looking for some clarification, as I also have values of 0.75 also. This leads me to believe my interpretation is incorrect and that a division has occurred?
Thanks in advance!
- Mark as New
- Bookmark
- Subscribe
- Mute
- Subscribe to RSS Feed
- Permalink
- Report Inappropriate Content
You saw this?
How Point Density works—Help | ArcGIS Desktop
referenced from this?
Point Density—Help | ArcGIS Desktop
Relying on an answer from someone else won't help. Make sure that your results make sense with respect to your cell size, any scaling and your input values
- Mark as New
- Bookmark
- Subscribe
- Mute
- Subscribe to RSS Feed
- Permalink
- Report Inappropriate Content
Thanks for your reply. I did take a look at those before posting, but still couldn't figure it out I'm afraid, hence the post.
- Mark as New
- Bookmark
- Subscribe
- Mute
- Subscribe to RSS Feed
- Permalink
- Report Inappropriate Content
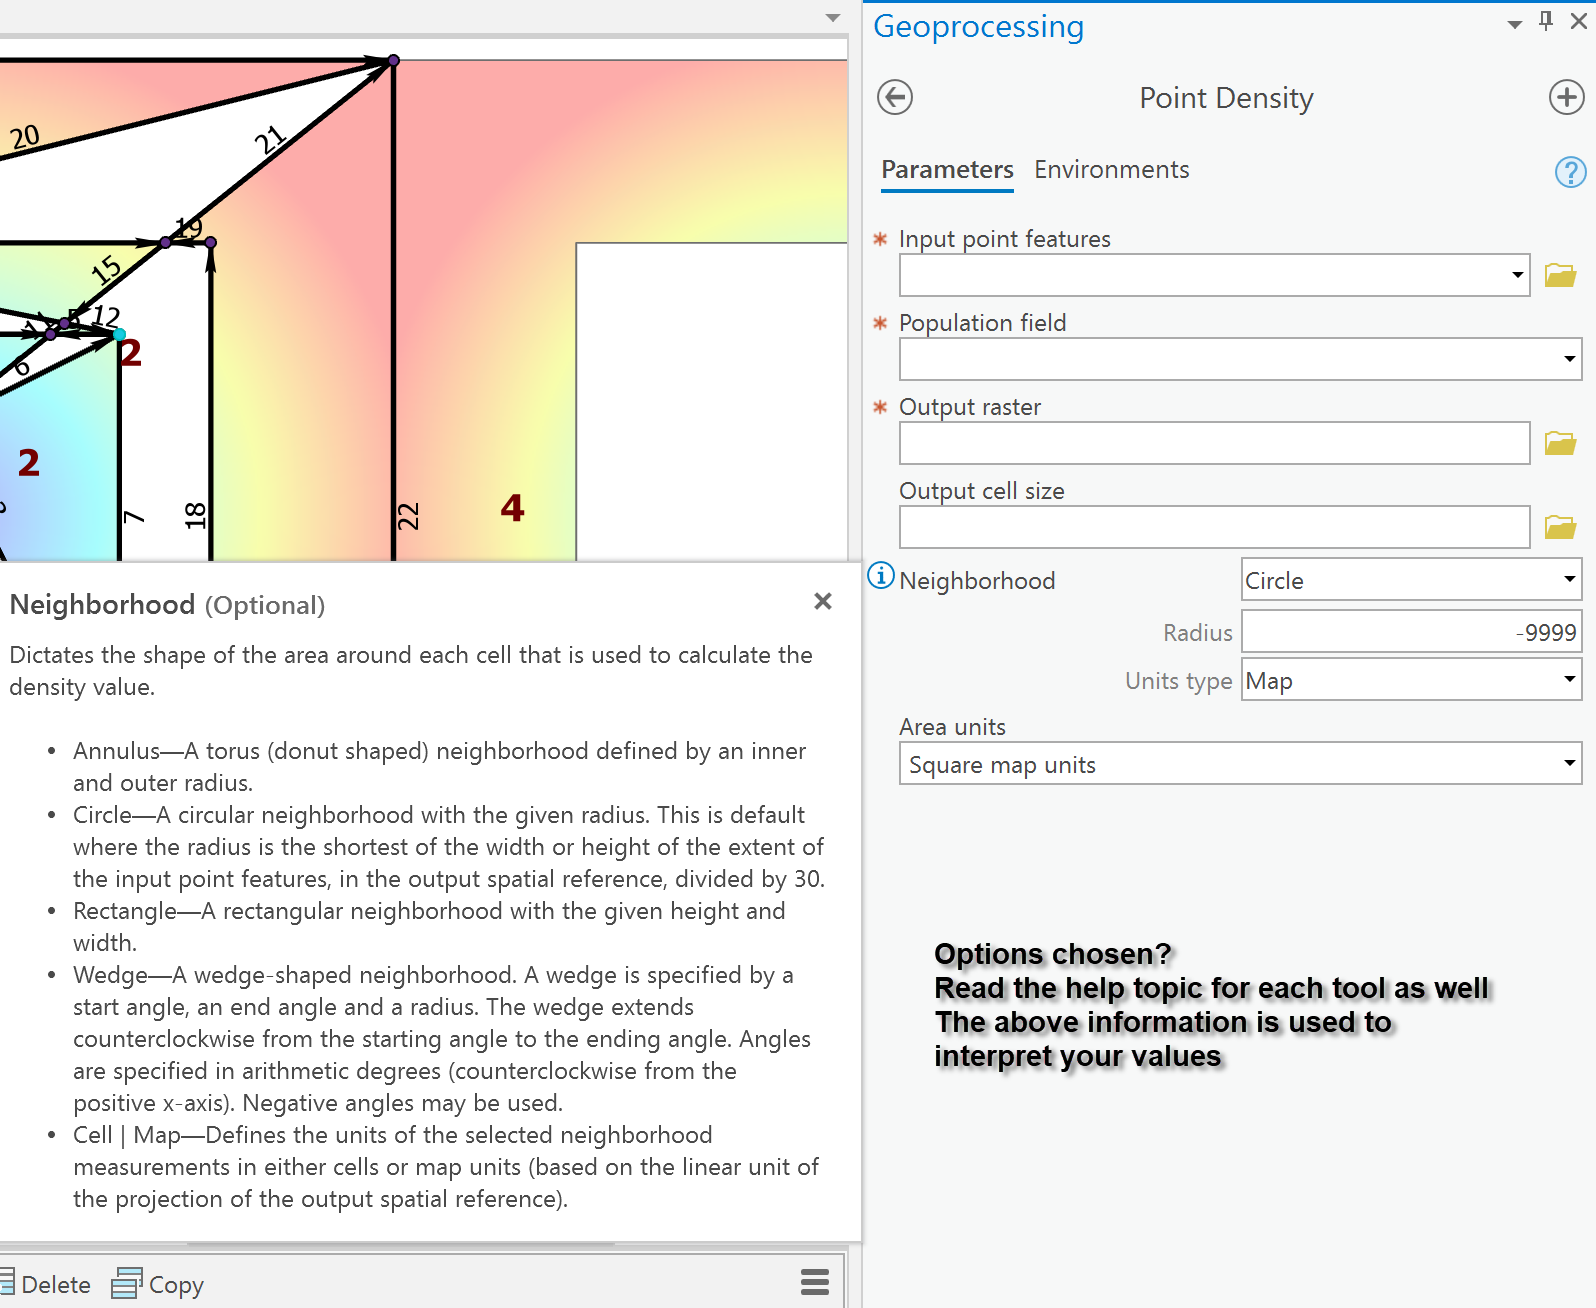
That would depend on the options your have specified.
Even 'defaults' have their implications and require interpretation.