- Home
- :
- All Communities
- :
- Products
- :
- ArcGIS Pro
- :
- ArcGIS Pro Questions
- :
- Re: Empty Bins in Line Chart
- Subscribe to RSS Feed
- Mark Topic as New
- Mark Topic as Read
- Float this Topic for Current User
- Bookmark
- Subscribe
- Mute
- Printer Friendly Page
Empty Bins in Line Chart
- Mark as New
- Bookmark
- Subscribe
- Mute
- Subscribe to RSS Feed
- Permalink
- Report Inappropriate Content
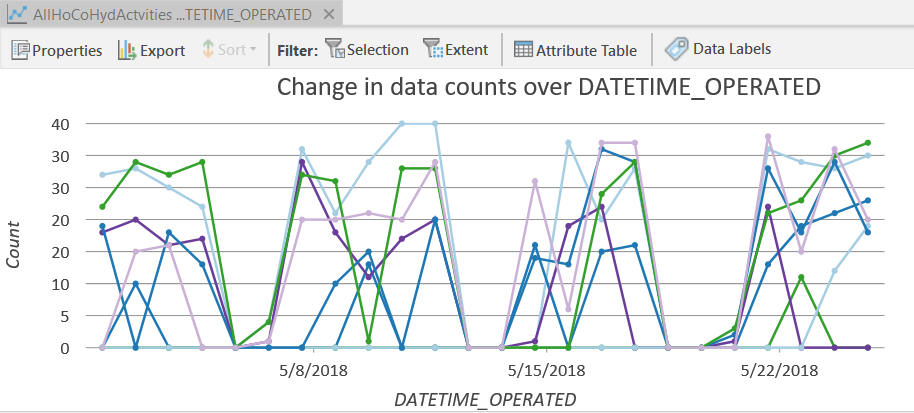
I have a dataset with recordings by date. For each weekend, I have zero recordings. The resultant line chart therefore drops down to zero each weekend. According to the Help Documentation here I should be configure a line chart to treat empty bins as zero (which I think it's doing) or to skip right over them by:
Interpolate neighboring values (Connect line)—Null values can be visually interpolated by connecting the line between the bins on either side of the empty bin.
How do I do this?
- Mark as New
- Bookmark
- Subscribe
- Mute
- Subscribe to RSS Feed
- Permalink
- Report Inappropriate Content
Hi Andrew,
It looks like these options are only available if you use the Sum, Mean or Median aggregation options in the chart properties:
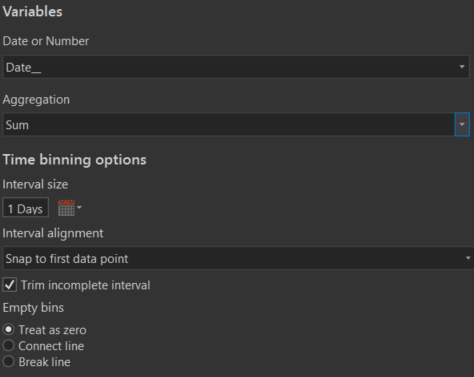
You could add a new field to your data and assign 1 to each feature. This can be used for Sum and would act in the same way as Count - although this might not be ideal if your data regularly changes.
Carmel
- Mark as New
- Bookmark
- Subscribe
- Mute
- Subscribe to RSS Feed
- Permalink
- Report Inappropriate Content
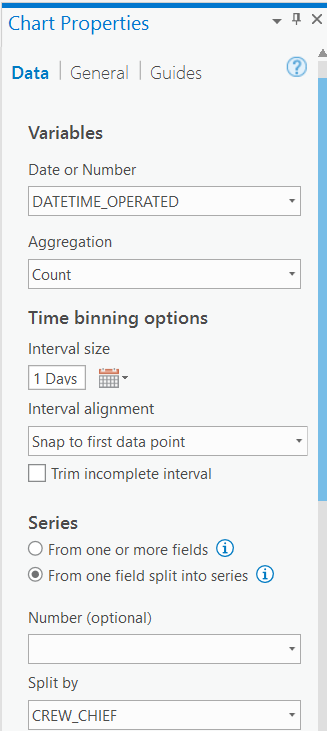
Thanks Carmel Connolly - to confirm if I chose to use 'Count' (which I want to do as I wish to see a count of submitted assessments per day) I don't have those Sum, Mean or Median aggregation options - see below. I did as you stated and added a new dummy numeric field, each containing a "1", and used that instead. However, yes, my data will be changing many times per hour and so this is not ideal at all. Can someone from the Arcgis Pro team offer a better solution?
- Mark as New
- Bookmark
- Subscribe
- Mute
- Subscribe to RSS Feed
- Permalink
- Report Inappropriate Content
Hi Andrew,
What version of ArcGIS Pro are you using? I'd tested using the latest version 2.2.3.
Carmel
- Mark as New
- Bookmark
- Subscribe
- Mute
- Subscribe to RSS Feed
- Permalink
- Report Inappropriate Content
I'm using Pro 2.3.3 also. Attached is a quick example of when switching to use COUNT the aggregation options disappear.
- Mark as New
- Bookmark
- Subscribe
- Mute
- Subscribe to RSS Feed
- Permalink
- Report Inappropriate Content
Hi Andrew,
I see now what you mean. Yes, those options do not exist for Count.
Tagging ArcGIS Pro and Kory Kramer for input 
Carmel
- Mark as New
- Bookmark
- Subscribe
- Mute
- Subscribe to RSS Feed
- Permalink
- Report Inappropriate Content
The empty bins options are only available if the data is summarized (sum, mean, or median). When counting incidents, no incidents equal zero incidents, therefore those other options are not available.
May I ask what exactly you are trying to visualize? If you interpolate the line over the weekend, it would make the visualization appear as if there had been counts over the weekend, when in fact there were none.
I'd be happy to work with you to figure this out,
Flora
- Mark as New
- Bookmark
- Subscribe
- Mute
- Subscribe to RSS Feed
- Permalink
- Report Inappropriate Content
Hello Flora Vale and thanks for clarifying the empty bins answers. The way you outlined it makes sense. This forum posting was just focused on increasing my understanding of Line Charting with Pro, not the whole project needs (I hijacked another thread here to do that), but you asked so here goes:
I have a dataset of Hydrant Inspections. It includes the time/date, location and several other descriptive attributes such as model, fabrication dates, condition found, nozzle size, etc, etc, etc. My main interest is around understanding the productivity of our crews: I want to look at this data set and understand if there are any lagging indicators related to productivity either in the form of statistically significant relationships between those descriptive attributes, or more interestingly, spatially or temporally. I then would like to attempt to transform those findings and use them for predictors (or leading trends) of productivity.
Thanks
A