- Home
- :
- All Communities
- :
- Products
- :
- Spatial Statistics
- :
- Spatial Statistics Questions
- :
- Re: Choosing conceptualization of spatial relation...
- Subscribe to RSS Feed
- Mark Topic as New
- Mark Topic as Read
- Float this Topic for Current User
- Bookmark
- Subscribe
- Mute
- Printer Friendly Page
Choosing conceptualization of spatial relationships - hot spot analysis
- Mark as New
- Bookmark
- Subscribe
- Mute
- Subscribe to RSS Feed
- Permalink
- Report Inappropriate Content
Hello, I am new to this forum so apologies if this topic has been raised already. I couldn't find any previous post which actually fully helped with my case. I have circa 270 polygons of different size and shapes for some countries in Asia. A few polygons are dispersed in space, but still have neighbours.
My aim is to run Hot spot analysis (Getis-Ord Gi*) on health related rates. I have run Global Moran's I using different spatial relationships, and I get the highest values of Global Moran's I when using contiguity methods and K-nearest neighbour with 8 neighbours.
All the 3 methods (contiguity edges only, corners, k-nn) result in Global Moran's I index = 0.70 more or less. On what basis do i choose between the three? Are there any pro and cons in using any of the 3 methods with the type of data that i have (poly with different size and shapes)? Should i rather go for a distance based methods?
Thank you!
- Mark as New
- Bookmark
- Subscribe
- Mute
- Subscribe to RSS Feed
- Permalink
- Report Inappropriate Content
CLASSIFICATION: UNCLASSIFIED
Carla,
Hot Spot analysis is approximate, especially Hot Spot analysis using polygons. That said the fellow that wrote the book on how to use hot spot analysis for polygons in my opinion was Luc Anselin using his GeoDa analysis engine. I would refer you to Luc's work to gain better insights into your analysis. If you want to e-mail him directly he currently is on faculty at the University of Chicago.
Best of Luck.
Bill Meyer
U.S. Army ERDC
Champaign, Il
- Mark as New
- Bookmark
- Subscribe
- Mute
- Subscribe to RSS Feed
- Permalink
- Report Inappropriate Content
Thank you for the advice! Best
- Mark as New
- Bookmark
- Subscribe
- Mute
- Subscribe to RSS Feed
- Permalink
- Report Inappropriate Content
The three methods (contiguity edges, edges + corner, k-nn) may be using similar neighborhoods for analysis. Depending on the layout of the polygons contiguity edges and edges + corner can produce very similar neighborhoods if there are few polygons that are only connected by a corner. Using edges + corners can have a big impact if you have a regular spaced grid (fishnet) as you double the neighborhood from 4 edges to 8 with edges + corners.
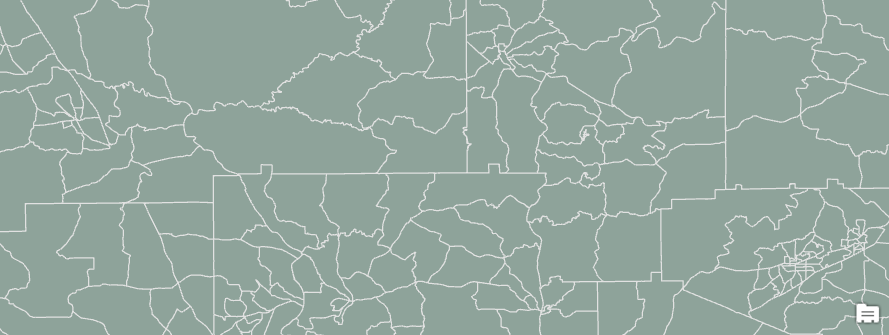
In this example polygon data set the majority of polygons are connected by edges
You can try to assess the number of neighbors each polygon is getting by using the Polygon Neighbors Tool it will create a table with a row for each polygon and its neighboring polygons. Using the Summary Statistics tool with a case field (group field) by the src_OBJECTID and counting the nbr_OBJECTID will produce a table with the number of neighbours for each polygon. If you create a bar chart using the number of neighbors you can see the distribution of number of neighbors. If the average distribution of number of neighbors is similar to the number of neighbors used in the analysis, it could help explain the similar results.
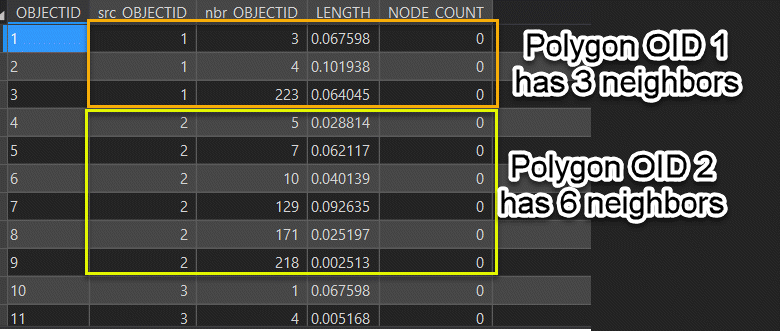 Table from Polygon Neighbors Tool
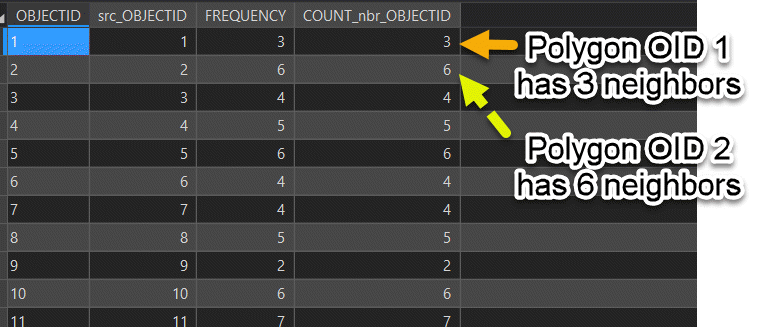
Results from Summary Statistics Tool
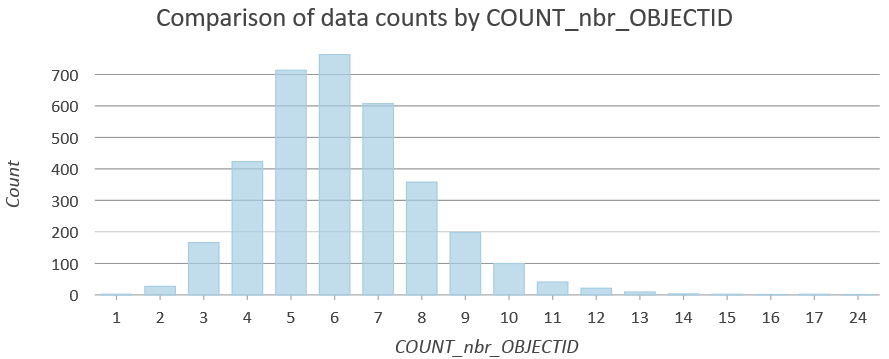 Chart showing distribution of number of neighbors
- Mark as New
- Bookmark
- Subscribe
- Mute
- Subscribe to RSS Feed
- Permalink
- Report Inappropriate Content
Thank you! I will look into this. Best