- Home
- :
- All Communities
- :
- Products
- :
- Mapping and Charting Solutions
- :
- Mapping and Charting Questions
- :
- Re: Is it possible to group categories in a bar ch...
- Subscribe to RSS Feed
- Mark Topic as New
- Mark Topic as Read
- Float this Topic for Current User
- Bookmark
- Subscribe
- Mute
- Printer Friendly Page
Is it possible to group categories in a bar chart?
- Mark as New
- Bookmark
- Subscribe
- Mute
- Subscribe to RSS Feed
- Permalink
- Report Inappropriate Content
ArcGIS Pro question:
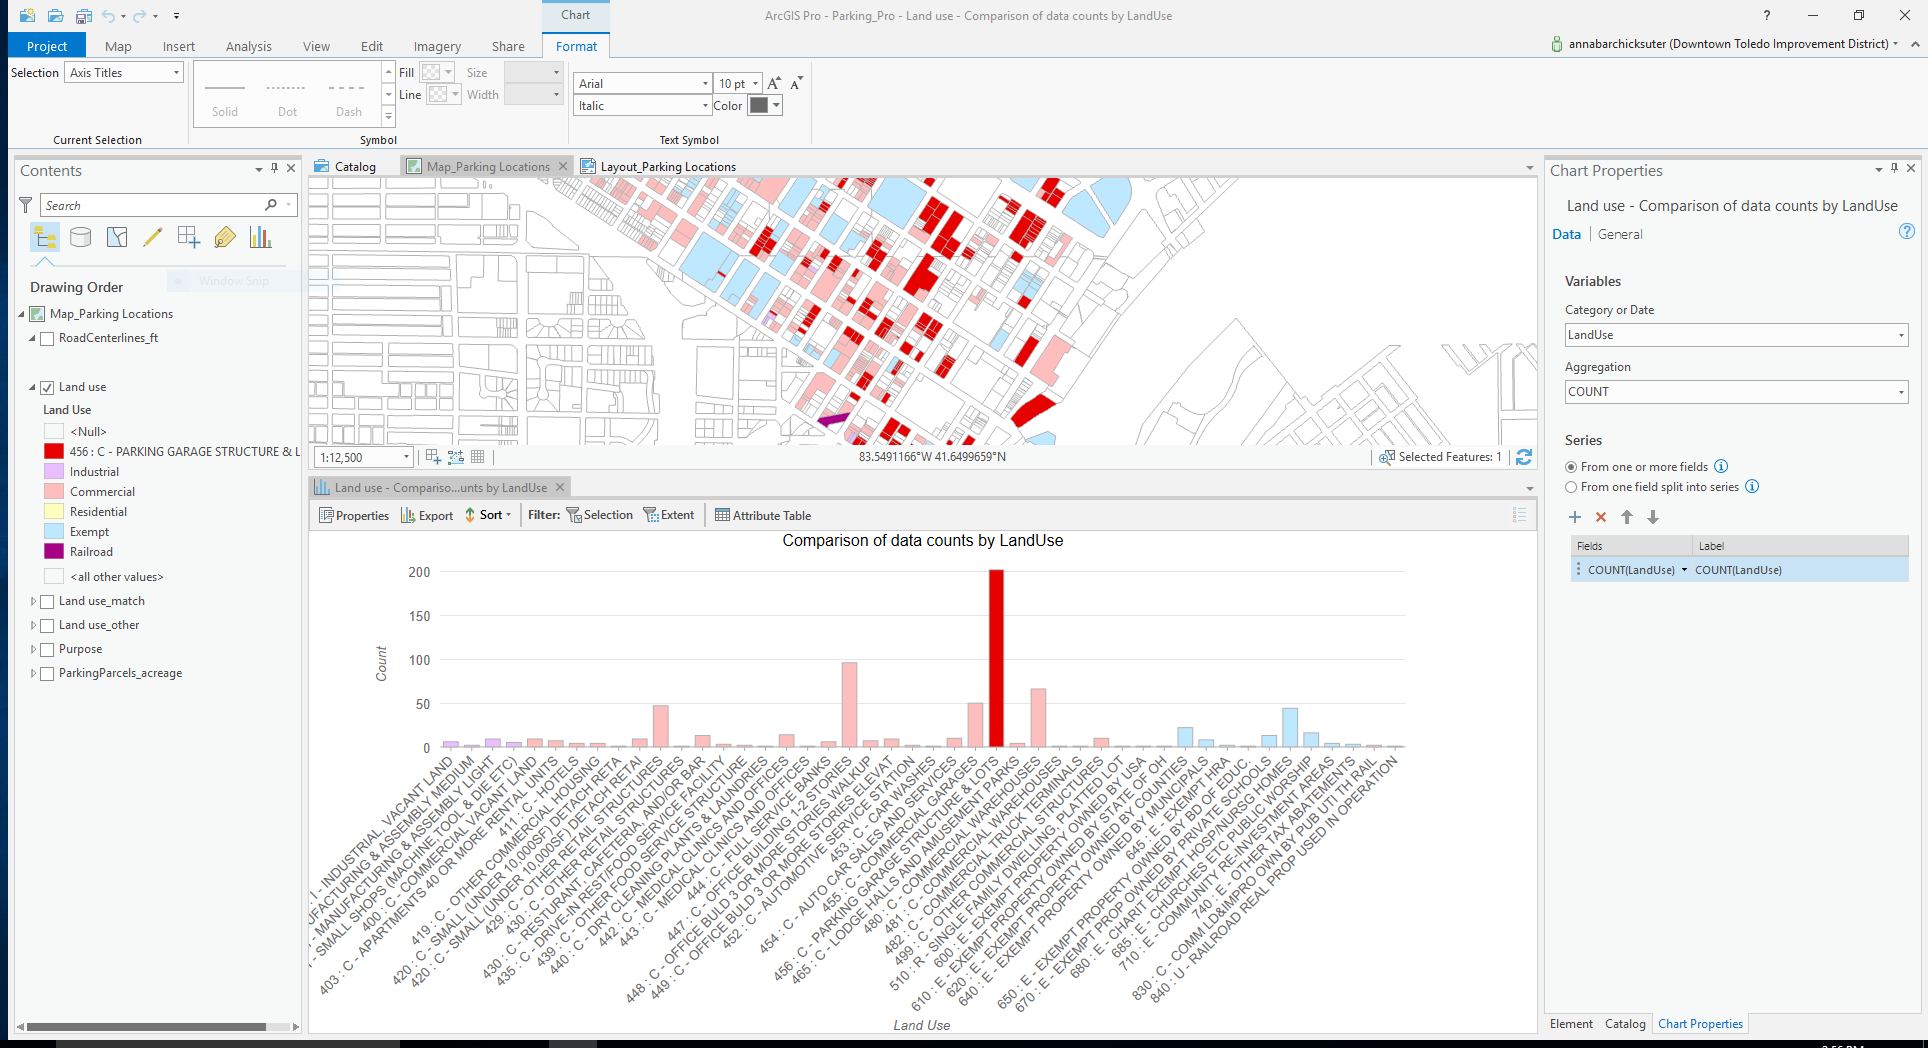
I'm creating a bar chart based for a layer I have in Pro. In my attribute table, I have 36 land use categories. They're all nuanced versions of broader designations. For example, "manufacturing and assembly" vs. "small shops (machine, tool, and die)" can both be grouped into the general "industrial" category. In the symbology pane, I'm able to group categories and narrow 36 down to 6 and color code just these 6 broad categories in my map.
For my bar chart, I just want to illustrate the number of parcels under these 6 broad designations. However, when I create a bar chart (with "land use" as the category, "count" as the aggregation method, and "from one or more fields" as my series type), I get 36 bars. I'd like to group these - just like my map layer - into 6 broad categories. Any thoughts on how to accomplish this?
- Mark as New
- Bookmark
- Subscribe
- Mute
- Subscribe to RSS Feed
- Permalink
- Report Inappropriate Content
Hi barchiac,
In order to create a chart of those broader categories, you'll need a field in your attribute table for general land use type. Once you create this field you can use that as your bar chart category.
Flora