- Home
- :
- All Communities
- :
- Developers
- :
- Developers - General
- :
- Developers Questions
- :
- Re: How to calculate flooded areas for the shore l...
- Subscribe to RSS Feed
- Mark Topic as New
- Mark Topic as Read
- Float this Topic for Current User
- Bookmark
- Subscribe
- Mute
- Printer Friendly Page
How to calculate flooded areas for the shore line
- Mark as New
- Bookmark
- Subscribe
- Mute
- Subscribe to RSS Feed
- Permalink
- Report Inappropriate Content
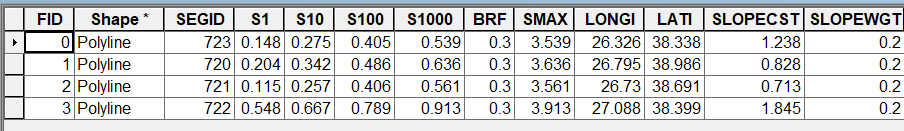
Hello everyone, am trying to calculate the flooded areas of a coastal area, I am using sea level rise and storm surge. The storm surges given are small stretches of the coastal line and I am stuck on how to go about this using arcpy. Below is the table of my storm surge with S10 meaning 10 years and S100 meaning 100 years with each row representing a stretch on the coastal area.
I tried to clip each row with the input raster data but i am getting errors.
fc = arcpy.GetParameterAsText(2)
inputraster = arcpy.GetParameterAsText(3)
with arcpy.da.SearchCursor(fc, ["SHAPE@"]) as cursor1:
for rows in cursor1:
geom = rows[0]
del cursor1
cursor = arcpy.da.SearchCursor(fc,['S10','S100'])
row = cursor.next()
while row:
while row[0]:
outputclip = outputfolder + str(row[0])+ "_C"
clipgeo = geom
extent = str(clipgeo.Extent)
arcpy.Clip_management(inputraster,extent,outputclip,"#","ClippingGeometry","MAINTAIN_EXTENT")Any help is really appreciated. Thanks.
- Mark as New
- Bookmark
- Subscribe
- Mute
- Subscribe to RSS Feed
- Permalink
- Report Inappropriate Content
I shared the data in the original question. The data is from the DIVA database for the European storm surge. And in your previous explanation I did not understand how to obtain the flooded area from the interpolated point in arcpy.
- Mark as New
- Bookmark
- Subscribe
- Mute
- Subscribe to RSS Feed
- Permalink
- Report Inappropriate Content
I downloaded the files, unzipped them, but an error occurs when I try to load the shapefile. Next time, it is better to add all the files to a single ZIP and attach that.
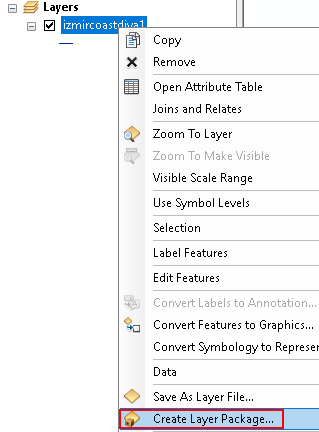
Could you share the layer as Layer Package? No need to ZIP the file when you attach it to the thread.
- Mark as New
- Bookmark
- Subscribe
- Mute
- Subscribe to RSS Feed
- Permalink
- Report Inappropriate Content
Updated the data.
- Mark as New
- Bookmark
- Subscribe
- Mute
- Subscribe to RSS Feed
- Permalink
- Report Inappropriate Content
I noticed that the lines are not continuous:

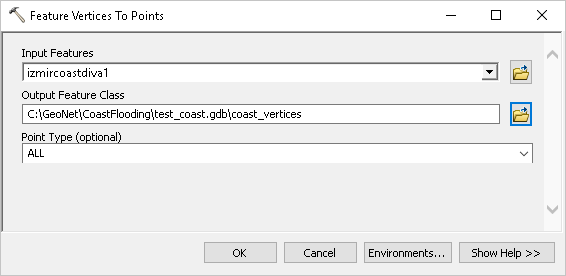
What I would probably do is convert the vertices to points:
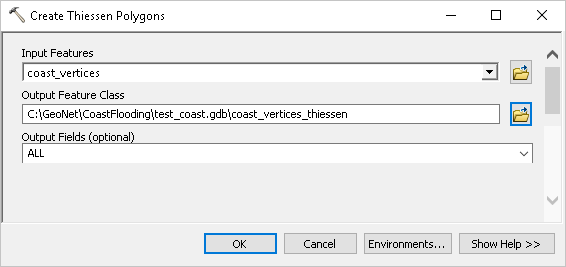
Create Thiessen polygons from the vertices:
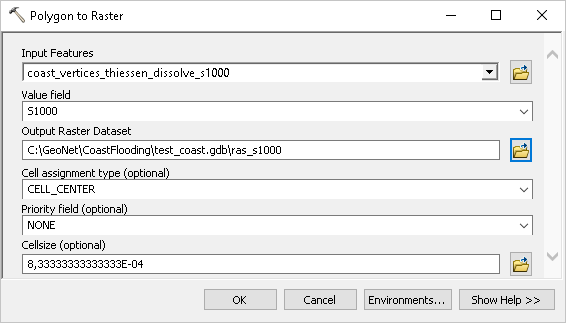
Dissolve those Thiessen polygons on the S1, S10, etc or a field containing a unique id identifying the original object ID (like INPUT_FID). Link back the values from S1 to S1000 to those polygon features. Convert polygons to raster:
... and calculate the flooded area:

The result will be something like this ("flooded" area in blue):
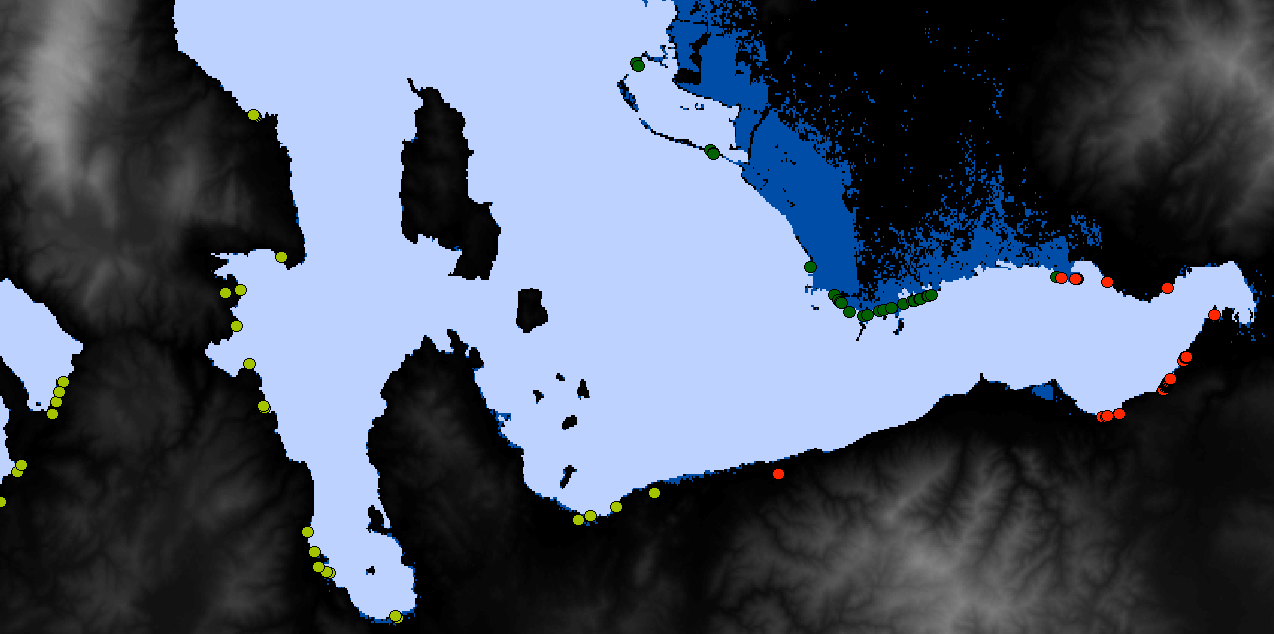
As you may have noticed there are isolated pixels that have height values below the S1000 value, however those get classified as flooded too when they should be classified as flooded. To do this better you could have a look at this thread: https://community.esri.com/message/354091?commentID=354091#comment-354091
You can script this, but since you just have 4 S values, you may not have to do this.
- Mark as New
- Bookmark
- Subscribe
- Mute
- Subscribe to RSS Feed
- Permalink
- Report Inappropriate Content
You may be interested in this post too: https://community.esri.com/people/GTaylor-esristaff/blog/2017/06/16/3d-flood-tools
- Mark as New
- Bookmark
- Subscribe
- Mute
- Subscribe to RSS Feed
- Permalink
- Report Inappropriate Content
Thanks, let me try working with this first and see what happens.
- Mark as New
- Bookmark
- Subscribe
- Mute
- Subscribe to RSS Feed
- Permalink
- Report Inappropriate Content
I tried following all the steps but I am getting incorrect output . Also i can not get around how to write a python script for the process
- « Previous
-
- 1
- 2
- Next »
- « Previous
-
- 1
- 2
- Next »