- Home
- :
- All Communities
- :
- Products
- :
- ArcGIS Spatial Analyst
- :
- ArcGIS Spatial Analyst Questions
- :
- Re: The Science (and Math) of Heat Maps
- Subscribe to RSS Feed
- Mark Topic as New
- Mark Topic as Read
- Float this Topic for Current User
- Bookmark
- Subscribe
- Mute
- Printer Friendly Page
The Science (and Math) of Heat Maps
- Mark as New
- Bookmark
- Subscribe
- Mute
- Subscribe to RSS Feed
- Permalink
- Report Inappropriate Content
I'm trying to model the geographic benefit of city capital investments in parks. Different kinds of park facilities have different service areas, and so I'm trying to model benefit by type of park, which means the benefit will extend outward different distances, depending on the type of park (playground, zoo, recreation center, etc).
So I've divided investments up by park type, and dropped a point at the center of each investment. So for my example, I want to make a heat map of the areas that benefit from a single new recreation center. Recreation centers in our city have a service area of a half-mile. And I know how to make a heat map that would show a benefit that would be high near the rec center, and taper down to nothing a half mile out, but I’d like to go a step further.
I would like my heat map to accurately model the approximate benefit of that public investment per acre. More specifically, I would like my map to work such that if you added together all the investment shown in the heat map I produce, in every impacted acre around the rec center, that sum would equal the total cost of that new rec center that was the initial point of input in creating that heat map. Or to put the same idea a different way, I’m looking for a way to incorporate three-dimensional calculus in my heat map modeling, where we can know the sum of the total area under the three-dimensional curve represented on the heat map I produce is equal to the total value of the investment in the point in the middle that was the input.
But how? And with what tool? (And in a perfect world, also looking to do the same around a linear facility, such as a recreation trail. But I’d be happy just to get an answer to the first part!)
Thanks in advance for any help, or similar efforts you can point me toward, as I’m coming up dry so far, but very much doubt I’m the first to do this sort of analysis!
- Mark as New
- Bookmark
- Subscribe
- Mute
- Subscribe to RSS Feed
- Permalink
- Report Inappropriate Content
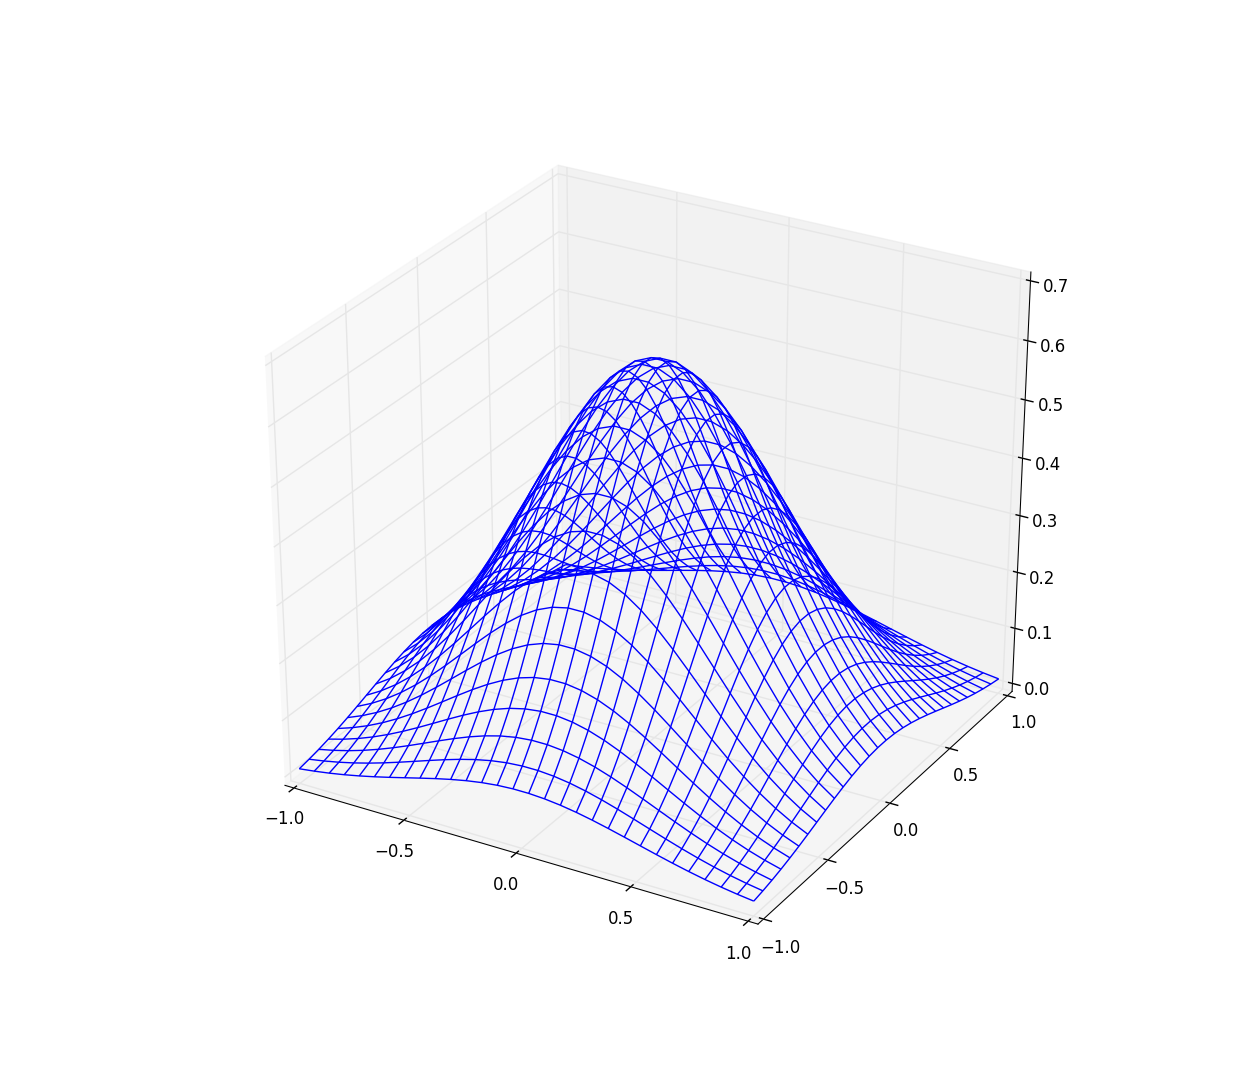
Are you trying to visualize what you have in 3D? (example of a bivariate Gaussian ) or integrate?
If the latter, the you should check whether SciPy offers anything beyond 2D integration.
On the other hand, if you are working with a raster representation of your data, then the cell size covers the x and y components and the z value will allow you to get that dimension,
You could consider a bounded area of raster cells as representing a 3d surface, which will enable you to standardize z with respect to (unit) area.
Or if this isn't what you are talking about .... never mind.
- Mark as New
- Bookmark
- Subscribe
- Mute
- Subscribe to RSS Feed
- Permalink
- Report Inappropriate Content
Dan, I think what I am talking about is the last thing you mention, regarding rasters. I mean, I'm not interested in any real-world 3d surfaces, but effectively, I want my heat map to approximate a theoretical 3d surface. The question then is how I would standardize the z value with respect to unit area. Sounds like I'd do a test case to see what the sum of all raster cells is for a particular point and divide (normalize) that by desired sum to get a particular ratio. Then I'd divide the z values in any rasters produced under the same conditions by the same amount to normalize/standardize. Now just have to remember which tools to use to do needed math on rasters, but I know I can figure that out.
Thank you. I think you gave me just the nudge I needed to figure this out. I'll report back when I'm successful. Because I'm assuming success. 
- Mark as New
- Bookmark
- Subscribe
- Mute
- Subscribe to RSS Feed
- Permalink
- Report Inappropriate Content
do check scipy, and matplot lib for function generators for sure
3d Gaussian