- Home
- :
- All Communities
- :
- Developers
- :
- Python
- :
- Python Questions
- :
- Re: Convert Summary Table Structure (Using Python)
- Subscribe to RSS Feed
- Mark Topic as New
- Mark Topic as Read
- Float this Topic for Current User
- Bookmark
- Subscribe
- Mute
- Printer Friendly Page
Convert Summary Table Structure (Using Python)
- Mark as New
- Bookmark
- Subscribe
- Mute
- Subscribe to RSS Feed
- Permalink
- Report Inappropriate Content
I originally posted the question under the following post: Python solution to convert single column into multiple columns but its seems I didn't explain clearly what I'm trying to achieve. I hope the following is a lot clearer as I desperately need to solve the following as I have few hundred table to process.
I have generated summary statistics tables based on the results of an intersection. The summary statistics table format is as per below:
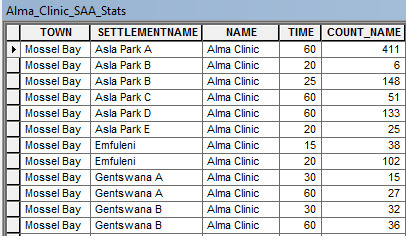
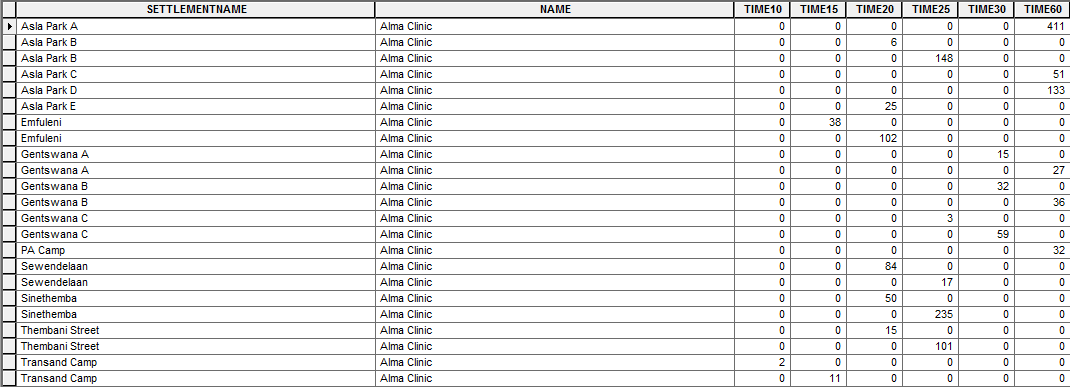
if you look at the following table as an example:
- Mossel Bay, Asla Park B, Alma Clinic appears twice as there 6 buildings found within 20 minutes and 148 buildings within 25 minutes.
I need to convert the table structure so that there is one entry for:
- Mossel Bay, Also Park B, Alma Clinic with the TIME field being split per interval (i.e. 5min, 10min - 60min) with the number of buildings (COUNT_NAME) being populated within the appropriate fields as per below:
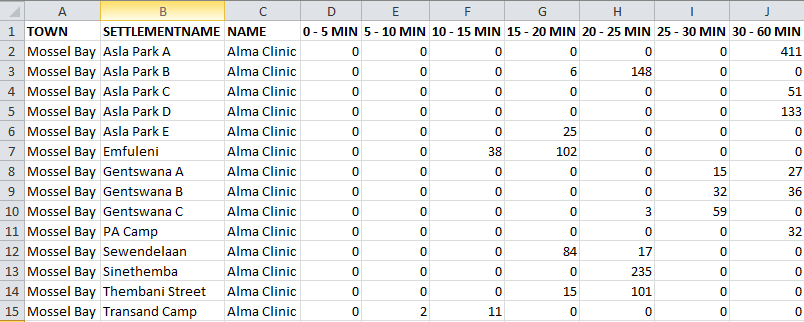
As you can see from the example above Mossel Bay, Asla Park B, Alma Clinic has a single row and the Number of buildings have been populated within the appropriate fields per time interval.
I've tried using ArcPy Data Access Module with no success as the rows are not unique so insert cursor wont work, can't use the update cursor as I'm trying to populate an empty table.
I was considering numpy, but would need some advice on how to get started and also considered python dictionaries and also realised my knowledge is limited at this stage. Any advice to solve the following would be appreciated.
- Mark as New
- Bookmark
- Subscribe
- Mute
- Subscribe to RSS Feed
- Permalink
- Report Inappropriate Content
Hi Daren
Can I ask that you re-post your code with the indentation corrected as I tried regenerating your code but most likely have the indentation incorrect and receiving error messages. Thanks in advance.
- Mark as New
- Bookmark
- Subscribe
- Mute
- Subscribe to RSS Feed
- Permalink
- Report Inappropriate Content
I've removed the long comments - I think this should be correct:
>>> times = set([])
... with arcpy.da.SearchCursor("Alma_Clinic_SAA_Stats$","TIME") as cursor:
...    for row in cursor:
...        times.add(row[0])
... time_dict = {}
... for i,item in enumerate(sorted(times)):
...    time_dict[item] = i + 3
... dict = {}
... with arcpy.da.SearchCursor("Alma_Clinic_SAA_Stats$","*") as cursor:
...    for row in cursor:
...        dict.setdefault(row[0]+'-'+row[1],[row[0],row[1],row[2]] + ([0]*len(time_dict)))
...        dict[row[0]+'-'+row[1]][time_dict[row[3]]] = row[4]
... final_rows = []
... for k,v in dict.iteritems():
...    final_rows.append(v)
... print final_rows
- Mark as New
- Bookmark
- Subscribe
- Mute
- Subscribe to RSS Feed
- Permalink
- Report Inappropriate Content
Hi Darren
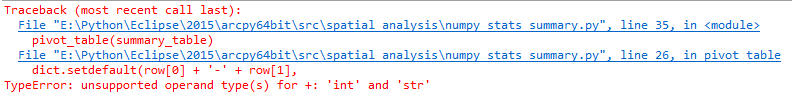
I'm getting the following error message, not sure if its because I'm still using ArcGIS 10.2.2 and Python 2.7.5
- Mark as New
- Bookmark
- Subscribe
- Mute
- Subscribe to RSS Feed
- Permalink
- Report Inappropriate Content
dict.setdefault(row[0]+'-'+row[1],[row[0],row[1],row[2]] + ([0]*len(time_dict)))
The above line translates to: In the dictionary "dict", create a key using a value like 'Mossel Bay-Asla Park A' (the first two columns in the Excel sheet). Set the value to a list like the following ['Mossel Bay','Asla Park A','Alma Clinic',0,0,0,0,0,0] (enough zeroes to accommodate all of the possible time bins).
Your error is probably telling you that in row[0]+'-'+row[1] you are trying to concatenate a number with a string. The '*' in the SearchCursor means all fields are read in order, so row[0] is first field, row[1] is second field, etc. This all means your fields are in a different order than mine (TOWN first, SETTLEMENT second, NAME third, TIME fourth, BUILDINGS fifth).
- Mark as New
- Bookmark
- Subscribe
- Mute
- Subscribe to RSS Feed
- Permalink
- Report Inappropriate Content
Thanks Darren
I'll check and correct the following
- Mark as New
- Bookmark
- Subscribe
- Mute
- Subscribe to RSS Feed
- Permalink
- Report Inappropriate Content
Peter
Please check logic, I have written it verbosely and included the data list (could come from csv file)
I haven't vectorized the 'loop' part
What it does
- determines the unique values based on the first 3 columns
- cycles through the data set finds the row or rows that match the previous
- pulls out the 'time' column (ie 't50') and places the 'Bldg' value and puts it into the output array
Haven't checked completely but let me know before I do any more
# coding: utf-8
import numpy as np

d =[('Mossel Bay','Asla Park A','Alma Clinic',60,411),('Mossel Bay','Asla Park B','Alma Clinic',20,6),
('Mossel Bay','Asla Park B','Alma Clinic',25,148),('Mossel Bay','Asla Park C','Alma Clinic',60,51),
('Mossel Bay','Asla Park D','Alma Clinic',60,133),('Mossel Bay','Asla Park E','Alma Clinic',20,25),
('Mossel Bay','Emfuleni','Alma Clinic',15,38),('Mossel Bay','Emfuleni','Alma Clinic',20,102),
('Mossel Bay','Gentswana A','Alma Clinic',30,15),('Mossel Bay','Gentswana A','Alma Clinic',60,27),
('Mossel Bay','Gentswana B','Alma Clinic',30,32),('Mossel Bay','Gentswana B','Alma Clinic',60,36),
('Mossel Bay','Gentswana C','Alma Clinic',25,3),('Mossel Bay','Gentswana C','Alma Clinic',30,59),
('Mossel Bay','PA Camp','Alma Clinic',60,32),('Mossel Bay','Sewendelaan','Alma Clinic',20,84),
('Mossel Bay','Sewendelaan','Alma Clinic',25,17),('Mossel Bay','Sinethemba','Alma Clinic',20,50),
('Mossel Bay','Sinethemba','Alma Clinic',25,235),('Mossel Bay','Thembani Street','Alma Clinic',20,15),
('Mossel Bay','Thembani Street','Alma Clinic',25,101),('Mossel Bay','Transand Camp','Alma Clinic',10,2),
('Mossel Bay','Transand Camp','Alma Clinic',15,11)]
"""
#TOWN, SETTLEMENT, NAME, TIME, BUILDINGS
dt = [('A','U20'),('B','U20'),('C','U20'),('5',np.int32),
      ('10',np.int32), ('15',np.int32),('20',np.int32),
      ('25',np.int32), ('30',np.int32),('60',np.int32)]
"""
dtv = [('A','U20'),('B','U20'),('C','U20'),('Time',np.int32), ('Bldgs',np.int32)]
v = np.array(d,dtype=dtv)         # create an array with dtv
uni = np.unique(v[['A','B','C']]) # get the unique on first 3 cols
shp = (len(uni),)                 # number of unique rows
# construct the output arrays
dt = [('A','U20'),('B','U20'),('C','U20'),('t5',np.int32),
      ('t10',np.int32), ('t15',np.int32),('t20',np.int32),
      ('t25',np.int32), ('t30',np.int32),('t60',np.int32)]
a = np.zeros(shp, dtype=dt)
a['A'] = uni['A']   # just assign the first 3 columns
a['B'] = uni['B']   # the values from the unique test
a['C'] = uni['C']   # everything is sorted!!!
for i in range(len(uni)): # show time... need to vectorize
    val = uni
    r = v[v[['A','B','C']] == val]
    for j in range(len(r)):
        col = 't'+ str(r['Time'])
        num = r['Bldgs']
        a[col] = num
print("\nOutput array...\n{}".format(a))
- Mark as New
- Bookmark
- Subscribe
- Mute
- Subscribe to RSS Feed
- Permalink
- Report Inappropriate Content
Consider if the summary wasn't done and assume that the data structure looks like this...
# demo TOWN, SETTLEMENT, NAME, TIME
data = [(u'Mossel Bay', u'Asla Park A', u'Alma Clinic', 6),
(u'Mossel Bay', u'Asla Park A', u'Alma Clinic', 25),
(u'Mossel Bay', u'Asla Park A', u'Alma Clinic', 21),
(u'Mossel Bay', u'Asla Park A', u'Alma Clinic', 22),
(u'Mossel Bay', u'Asla Park A', u'Alma Clinic', 22),
(u'Mossel Bay', u'Asla Park B', u'Alma Clinic', 51),
(u'Mossel Bay', u'Asla Park B', u'Alma Clinic', 18),
(u'Mossel Bay', u'Asla Park B', u'Alma Clinic', 4),
(u'Mossel Bay', u'Asla Park C', u'Alma Clinic', 55),
(u'Mossel Bay', u'Asla Park C', u'Alma Clinic', 40)]
# ad nauseum ..............
# ---- Begin by constructing dtype by parts... useful later on
# dt0 = [('A','U20'),('B','U20'),('C','U20')]
d_names=['A','B','C'] # used in 2 places
d_type = ['U20','U20','U20'] # unicode encoding
dt0= zip(d_names,d_type) # see above
dt1 = dt0 + [('Time','<i4')] # data array's dtype
#
# ---- dtype for full array, bins, bin classes and unique
bins = [0, 5, 10, 15, 20, 25, 30, 60]
binclass = [('t'+str(i),'<i4') for i in bins[:-1]] # skip last (60)
#
a = np.array(data, dtype=dt1)
uni = np.unique(a[d_names])
#
out =[]
for u in uni:
vals = a[a[d_names] == u ]['Time'].tolist()
hist, edges = np.histogram(vals,bins)
result = tuple(u) + tuple(hist)
out.append(result)
dt2 = dt0 + binclass
out_array = np.array(out,dtype=dt2)
print("final array\n{}".format(out_array))
Would this suffice?
final array
[(u'Mossel Bay', u'Asla Park A', u'Alma Clinic', 0, 1, 0, 0, 3, 1, 0)
(u'Mossel Bay', u'Asla Park B', u'Alma Clinic', 1, 0, 0, 1, 0, 0, 1)
(u'Mossel Bay', u'Asla Park C', u'Alma Clinic', 0, 0, 0, 0, 0, 0, 2)]
Written verbosly, I hope everything is clear. There is a bit of magic in line 22 to ensure that the upper limit isn't given. You can also bin left or right of the boundary value, I chose left so that bin =0 is the lower limit of the 0-<5 range. Line 22, just adds a 't' and a data type together for use in the final array construction where line 33 makes the final dtype from the sum of dt0 and binclass.
Obviously, this can go out to a table etc. The input data is easiest from a csv file). Let me know Peter if this is ok and I can write it up better.
PS
If you want to collect other information it can be done on the go as well
>>> for u in uni:
... vals = a[a[d_names] == u ]['Time']
... print("n {}, mean {}, min {}, max {}".format(len(vals),vals.mean(), vals.min(), vals.max()))
...
n 5, mean 19.2, min 6, max 25
n 3, mean 24.333333333333332, min 4, max 51
n 2, mean 47.5, min 40, max 55
>>>
you can collect it in a separate list, or add the necessary dtype to the output array ( ie ('Mean','<f8')... )
and have it saved as well to save you some other steps.
ADDENDUM
Peter, I have attached a fuller version of both examples including the last one that produces the mean, min, max values within the output array as well as the histogram.
- Mark as New
- Bookmark
- Subscribe
- Mute
- Subscribe to RSS Feed
- Permalink
- Report Inappropriate Content
Hi Dan
Thanks for the following. I'm going to go through the following over the weekend. I'll post my final code on Monday so that anyone else trying to achieve solving a similar problem can use it as a starting point. Thanks once again for all the help.
- Mark as New
- Bookmark
- Subscribe
- Mute
- Subscribe to RSS Feed
- Permalink
- Report Inappropriate Content
I have attached a zip file with simplified data containing
- a gdb with 3 tables of 1000, 10,000 and 100,000 records
- an excel file with 10,000 (ran into the >65K error) records
- an npy containing the 100,000 records (npy is a compressed binary array so you can work with arrays directly)
To load the gdb and excel files, just the usual.
To load the npy file (and save)
>>> zz =r"F:\A_arc_np_py\A0_arc_np_py\tabular\array_100K.npy" # create the *.npy file name and save
>>> np.save(zz,a)
>>> # leisurely return to your work and load it up
>>> zz =r"F:\A_arc_np_py\A0_arc_np_py\tabular\array_100K.npy"
>>> np.load(zz)
array([(1, 0, 'A', 'B_', 'Hall', 40, 36), (2, 1, 'C', 'B_', 'Hall', 44, 212),
(3, 2, 'C', 'B_', 'Hosp', 21, 227), ...,
(99998, 99997, 'B', 'A_ ', 'Hosp', 42, 50),
(99999, 99998, 'A', 'B_', 'Hall', 14, 129),
(100000, 99999, 'B', 'C_', 'Hall', 10, 89)],
dtype=[('OBJECTID', '<i4'), ('f0', '<i4'), ('County', '<U2'), ('Town', '<U6'), ('Facility', '<U8'), ('Time', '<i4'), ('People', '<i4')])
>>>
>>> # big slice in the middle in case you didn't notice.
I hardcoded a script to show the generic syntax for processing it.
# coding: utf-8
"""
Script: observation_summary_demo_2016_04_02.py
Author:
Dan.Patterson@carleton.ca
Modified: 2016-04-02
Purpose: Demonstrate the use of np.unique and np.histogram for data
summary and presentation.
Reference:
https://community.esri.com/thread/174845
"""
import numpy as np
np.set_printoptions(edgeitems=3,linewidth=80,precision=2,
suppress=True,threshold=20,
formatter={'float': '{: 0.3f}'.format})
def run_stuff(a):
"""Run the sample with the table. All the variables are in the top section.
"""
# ---- variables are here
key_flds = ['County','Town','Facility']
class_fld = 'Time'
val_fld = 'People'
bins = [0, 5, 10, 15, 20, 25, 30, 60]
bin_dt = [('t'+str(i),'<i4') for i in bins[:-1]] # skip last (60)
stats_dt = [('Mean','<f8'),('Min','<f8'),('Max','<f8')]
# ---- actual run
uni = np.unique(a[key_flds])
dt0 = uni.dtype.descr
out =[]
for u in uni:
vals = a[a[key_flds] == u ][class_fld]
hist, edges = np.histogram(vals.tolist(),bins)
stats = (np.median(vals), vals.min(), vals.max()) # as integers
result = tuple(u) + tuple(hist) + stats
out.append(result)
# ---- combine the dtypes, produce and print the array
dt2 = dt0 + bin_dt + stats_dt
out_array = np.array(out,dtype=dt2)
print("final array\n{!s:}\nfields {}".format(out_array, out_array.dtype.names))
return out_array
# ---- main section ----
if __name__=="__main__":
"""sample run to do Peters work"""
#
# ----- Change file name
in_tbl = r"Your\Path_Here\summary_demo.gdb\sample_100K" # path
out_tbl = in_tbl + "result"
#
a = arcpy.da.TableToNumPyArray(in_tbl,"*") # * all fields
b = run_stuff(a)
#
arcpy.da.NumPyArrayToTable(b,out_tbl)
The 100,000 input array yielded 24 records as expected with an expected distribution. I have the code posted on my blog on how to do data creation with know distributions.
The results (with a snip out of the middle)
>>> len(a) # input array of 100,000 observations
100000
>>> b # output summary array
array([('A', 'A_ ', 'Hall', 376, 519, 510, 483, 525, 483, 3116, 31.0, 1.0, 60.0),
('A', 'A_ ', 'Hosp', 404, 506, 489, 478, 520, 505, 3055, 30.0, 1.0, 60.0),
('A', 'B_', 'Hall', 310, 386, 396, 345, 361, 356, 2302, 30.5, 1.0, 60.0),
...,
('D', 'B_', 'Hosp', 91, 116, 126, 137, 135, 138, 798, 31.0, 1.0, 60.0),
('D', 'C_', 'Hall', 91, 137, 124, 125, 139, 110, 764, 30.0, 1.0, 60.0),
('D', 'C_', 'Hosp', 98, 111, 120, 144, 124, 128, 765, 31.0, 1.0, 60.0)],
dtype=[('County', '<U2'), ('Town', '<U6'), ('Facility', '<U8'), ('t0', '<i4'), ('t5', '<i4'),
('t10', '<i4'), ('t15', '<i4'), ('t20', '<i4'), ('t25', '<i4'), ('t30', '<i4'),
('Mean', '<f8'), ('Min', '<f8'), ('Max', '<f8')])
>>>
Give it try... obviously, the __main__ could be looped if the data structure is the same and you just need to provide file names.
PS
You can do column sums as well. I will show the logic using a list comprehension as an example to show the number of people that fell within each time category
>>> sums = [ b[i].sum() for i in ['t0','t5','t10','t15','t20','t25','t30']]
>>> sums
[6514, 8384, 8514, 8213, 8495, 8273, 51607]
>>> sum(sums)
100000
>>>
- Mark as New
- Bookmark
- Subscribe
- Mute
- Subscribe to RSS Feed
- Permalink
- Report Inappropriate Content
Hi Dan
Based on reading up on Numpy and Pandas I have come up with the following. The following is still work in progress based on my initial understanding of Numpy Arrays and Pandas DataFrames:
'''
Created on April 6, 2016


Summarise


Number of Buildings


per Time Interval


(5, 10, 15, 25, 30, 60)


@author: PeterW
'''
# import site-packages and modules
from pathlib import Path
import numpy.lib.recfunctions as rfn
import pandas as pd  # Pandas version 0.13.0
import arcpy


# set arguments
saa_stats_table = r"E:\Python\Testing\Numpy_Pivot_Table\Input_Data.gdb\Alma_Clinic_Sum"


# environment settings
arcpy.env.overwriteOutput = True
fgdb = Path(saa_stats_table).parents[0]


def pivot_table(saa_stats_table, fgdb):
    fields = [f.name for f in arcpy.ListFields(saa_stats_table)]
    table_recarray = arcpy.da.TableToNumPyArray(saa_stats_table, fields)  # @UndefinedVariable
    df = pd.DataFrame(table_recarray[fields])
    pivot = df.pivot(index="OBJECTID",
                    columns="TIME",
                    values="FREQUENCY").fillna(0, downcast="infer")
    pivot_fields = pivot.columns.values
    # rename pivot fields with prefix "TIME"
    pivot.columns = [("{0}{1}".format("TIME", field)) for field in pivot_fields]
    # convert pandas dataframe to record array
    pivot_recarray = pivot.to_records(index=False)
    pivot_type = pivot_recarray.dtype.descr
    pivot_type_new = [(x[0], x[1].replace(x[1], "<i2")) for x in pivot_type]
    # change pivot record array data type to short integer
    pivot_recarray = pivot_recarray.astype(pivot_type_new)
    fields2 = ["TOWN", "SETTLEMENTNAME", "NAME"]
    table_type_new = [(str(x), "<U25") for x in fields2]
    # change table array data type to unicode 50 characters
    table_recarray = table_recarray[fields2].astype(table_type_new)
    recarray_list = [table_recarray, pivot_recarray]
    # merge table and pivot record array
    summary_array = rfn.merge_arrays(recarray_list, flatten=True, usemask=False)
    summary_table = str(Path(fgdb, "SAA_Stats"))
    # convert merged record array to file geodatabase table
    if arcpy.Exists(summary_table):
        arcpy.Delete_management(summary_table)
        arcpy.da.NumPyArrayToTable(summary_array, summary_table)  # @UndefinedVariable
    else:
        arcpy.da.NumPyArrayToTable(summary_array, summary_table)  # @UndefinedVariable


pivot_table(saa_stats_table, fgdb)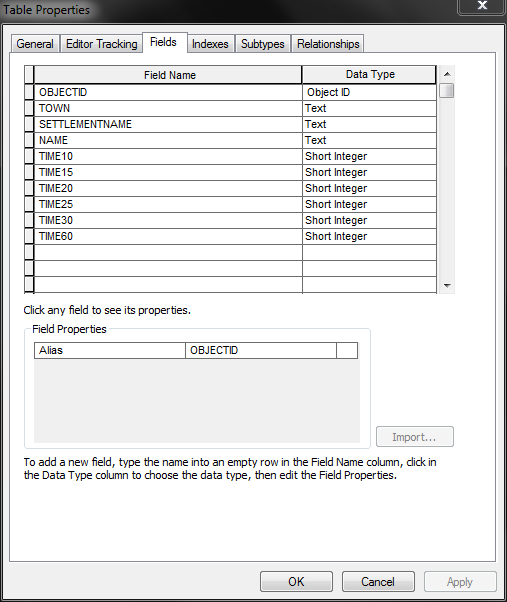
Summary Table: Field Properties
Summary Table: Results
I'm currently reading through the documentation that you have supplied and will get back to you once I've read the python reference documentation to better understand how the following works.