- Home
- :
- All Communities
- :
- Developers
- :
- Python
- :
- Python Questions
- :
- Re: Iterate and Add Values from many fields
- Subscribe to RSS Feed
- Mark Topic as New
- Mark Topic as Read
- Float this Topic for Current User
- Bookmark
- Subscribe
- Mute
- Printer Friendly Page
- Mark as New
- Bookmark
- Subscribe
- Mute
- Subscribe to RSS Feed
- Permalink
- Report Inappropriate Content
Can somebody please help me, I have been struggling with this part of my script for hours now.
I need to list the precip fields from my point feature class:
Create empty MaxValue list
For every record in my attribute table:
Add up(SUM) values from first 6 fields [0]-[5] and append value to list (by record line)
Add up(SUM) values from next group of 6 fields [1]-[6] and append value to list
Add up(SUM) values from next group of 6 fields [2]-[7] and append value to list
Loop to end of field list making sure it does not error at the end if it is not a full group of 6 records
After I have a MaxValue list it finds the MAX from that list and adds that to the MaxPrecip field. (I think I can get this part its just incrementally iterating over and summing groups of fields by record that is killing me)
Repeat for every point, there may be thousands of points and 20 or 120 fields.
>>> PrecipFields = [f.name for f in arcpy.ListFields("asciiPoints","*")]
>>> with arcpy.da.UpdateCursor("asciiPoints",PrecipFields) as cursor:
... for row in cursor:
... MaxValue = []
... i = 0
... for i in range(len(PrecipFields)):
... v = row + row[i+1] + row[i+2] + row[i+3] + row[i+4] + row[i+5]
... Val.append(v)
... i = i+1
Am I even close?
Thanks
Solved! Go to Solution.
Accepted Solutions
- Mark as New
- Bookmark
- Subscribe
- Mute
- Subscribe to RSS Feed
- Permalink
- Report Inappropriate Content
Jake
Interesting problem, sorry I didn't get to it, but I have two examples, one pertinent which I would like you to confirm.
The first example is to determine the maximum value found in 1x4 blocks for every 1x4 block in a row, then get a row max.
The second example, is to determine the sum in the 1x4 blocks for every 1x4 block in the row, then get the maximum sum.
I used integers, 20 per row and only 5 row, but the problem can easily be extended to many columns and rows and for any number of block sizes accounting for rows that aren't divisable by the block (ie 20 values in a row with a 1x3 block leaves 2 values left over which can be accounted for or dumped)
So here is the data, and I would appreciate any comments on whether this is the question(s) and the result you are looking for. I will provide more details later.
:---- Example 1 ----
1.  Input data.... subdivide the data into 1x4 blocks
[[  1  2  3  4  5  6  7  8  9  10  11  12  13  14  15  16  17  18  19  20]
[ 21  22  23  24  25  26  27  28  29  30  31  32  33  34  35  36  37  38  39  40]
[ 41  42  43  44  45  46  47  48  49  50  51  52  53  54  55  56  57  58  59  60]
[ 61  62  63  64  65  66  67  68  69  70  71  72  73  74  75  76  77  78  79  80]
[ 81  82  83  84  85  86  87  88  89  90  91  92  93  94  95  96  97  98  99 100]]


2.  Now imagine what that would look like if subdivided

3.  maximum of each 1x4 block in each row
[[  4  8  12  16  20]
[ 24  28  32  36  40]
[ 44  48  52  56  60]
[ 64  68  72  76  80]
[ 84  88  92  96 100]]

4.  maximum of (2) by row
[ 20  40  60  80 100]

: ---- Example 2 ----
5.  Let's do the sum of each 1x4 block and determine the row max

6. sums of each 1x4 block in each row
[[ 10  26  42  58  74]
[ 90 106 122 138 154]
[170 186 202 218 234]
[250 266 282 298 314]
[330 346 362 378 394]]

7. maximum of (6) by row
[ 74 154 234 314 394]
Hope this makes sense, and I look forward to feedback.
- Mark as New
- Bookmark
- Subscribe
- Mute
- Subscribe to RSS Feed
- Permalink
- Report Inappropriate Content
Hi Jake,
It may help to see a sample of the attribute table. Are you able to upload one?
- Mark as New
- Bookmark
- Subscribe
- Mute
- Subscribe to RSS Feed
- Permalink
- Report Inappropriate Content
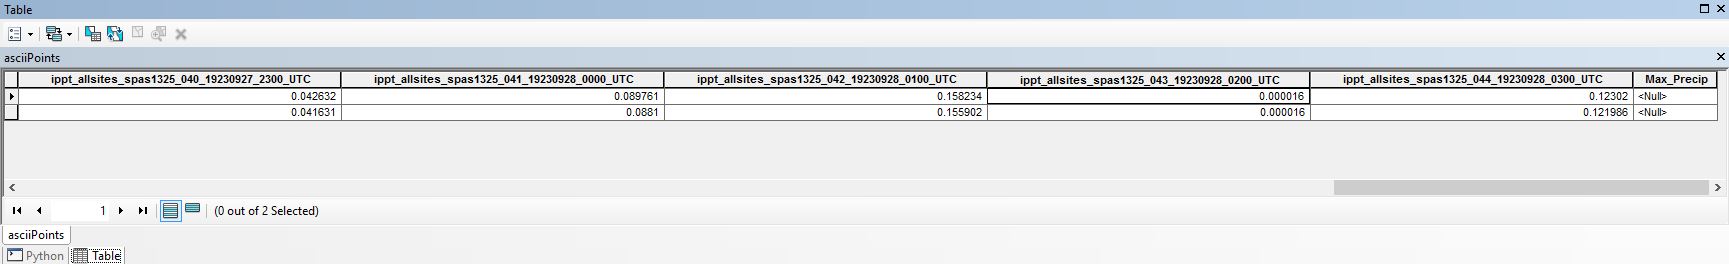
Hope this is legible. Each field represents 1 hours worth of precipitation for a particular storm for a particular grid cell. This example has only 2 records for simplicity, the actual database will have thousands. What I want to do is find the consecutive 6 hour period that had the largest total precipitation for every record and input that value to the Max_Precip field. So it would take fields [0] - [5],[1]-[6], [2]-[7],,ect and sum the total for each of those durations and and put them in a list. Then before it moves to the next record it would find the max precipitation amount for whatever duration had the most precipitation from the list and update the Max_Precip field. Then clear the list and do the same for the next record. Unless there is an easier way. Hope that makes sense....
- Mark as New
- Bookmark
- Subscribe
- Mute
- Subscribe to RSS Feed
- Permalink
- Report Inappropriate Content
Try the following:
PrecipFields = [f.name for f in arcpy.ListFields(table,"Precip*")] with arcpy.da.SearchCursor(table, PrecipFields) as cursor: maxValue = [] for row in cursor: i = 0 j = 5 precipSum = [] while j < len(PrecipFields): try: v = row + row[i + 1] + row[i+2] + row[i+3] + row[i+4] + rowprecipSum.append(v) i += 1 j += 1 except: break maxValue.append(sorted(precipSum)[-1]) del cursor i = 0 with arcpy.da.UpdateCursor(table, ["Max_Precip"]) as cursor: for row in cursor: row[0] = maxValue i += 1 cursor.updateRow(row) del cursor
- Mark as New
- Bookmark
- Subscribe
- Mute
- Subscribe to RSS Feed
- Permalink
- Report Inappropriate Content
Jake
Interesting problem, sorry I didn't get to it, but I have two examples, one pertinent which I would like you to confirm.
The first example is to determine the maximum value found in 1x4 blocks for every 1x4 block in a row, then get a row max.
The second example, is to determine the sum in the 1x4 blocks for every 1x4 block in the row, then get the maximum sum.
I used integers, 20 per row and only 5 row, but the problem can easily be extended to many columns and rows and for any number of block sizes accounting for rows that aren't divisable by the block (ie 20 values in a row with a 1x3 block leaves 2 values left over which can be accounted for or dumped)
So here is the data, and I would appreciate any comments on whether this is the question(s) and the result you are looking for. I will provide more details later.
:---- Example 1 ----
1.  Input data.... subdivide the data into 1x4 blocks
[[  1  2  3  4  5  6  7  8  9  10  11  12  13  14  15  16  17  18  19  20]
[ 21  22  23  24  25  26  27  28  29  30  31  32  33  34  35  36  37  38  39  40]
[ 41  42  43  44  45  46  47  48  49  50  51  52  53  54  55  56  57  58  59  60]
[ 61  62  63  64  65  66  67  68  69  70  71  72  73  74  75  76  77  78  79  80]
[ 81  82  83  84  85  86  87  88  89  90  91  92  93  94  95  96  97  98  99 100]]


2.  Now imagine what that would look like if subdivided

3.  maximum of each 1x4 block in each row
[[  4  8  12  16  20]
[ 24  28  32  36  40]
[ 44  48  52  56  60]
[ 64  68  72  76  80]
[ 84  88  92  96 100]]

4.  maximum of (2) by row
[ 20  40  60  80 100]

: ---- Example 2 ----
5.  Let's do the sum of each 1x4 block and determine the row max

6. sums of each 1x4 block in each row
[[ 10  26  42  58  74]
[ 90 106 122 138 154]
[170 186 202 218 234]
[250 266 282 298 314]
[330 346 362 378 394]]

7. maximum of (6) by row
[ 74 154 234 314 394]
Hope this makes sense, and I look forward to feedback.
- Mark as New
- Bookmark
- Subscribe
- Mute
- Subscribe to RSS Feed
- Permalink
- Report Inappropriate Content
Thanks Dan. I knew you would have an interesting and creative way to attack this. Yes, example number 2 is exactly what I am looking for. And that's great because in my example I mentioned 6hr but I will also be doing this for 24 and 72 hour durations as well.
- Mark as New
- Bookmark
- Subscribe
- Mute
- Subscribe to RSS Feed
- Permalink
- Report Inappropriate Content
I will be posting a blog sometime today and it also deals with the case of missing data (you just need to do use a masked array). You can determine other statistical parameters if you need them, but I suspect you are looking for max, total rainfall in an X period or something like that
- Mark as New
- Bookmark
- Subscribe
- Mute
- Subscribe to RSS Feed
- Permalink
- Report Inappropriate Content
JAKE RODEL done... Working with blocks of data...
If you would prefer to use rolling data, rather than data blocked by year, then that example can be explained. I used a 360 day year and 30 day month in the examples.
Rolling data, in case anyone is interested, takes a time series in sequential order from a start data and runs it as a big long sequence, not broken up by year or month. You can 'block' the data into chunks of 7, 30, 365 increments sort of representing weekly, monthly and annual values. You could make your life more difficult and contribute little to the statistical outcome, by using the actual number of days in a month (ie 28/29, 30 or 31) and the actual days in a year (365, 366... not going to go to 365.25 place)