- Home
- :
- All Communities
- :
- Products
- :
- Geoprocessing
- :
- Geoprocessing Questions
- :
- Re: How to import a dataset table into Arcmap and ...
- Subscribe to RSS Feed
- Mark Topic as New
- Mark Topic as Read
- Float this Topic for Current User
- Bookmark
- Subscribe
- Mute
- Printer Friendly Page
How to import a dataset table into Arcmap and interpret it
- Mark as New
- Bookmark
- Subscribe
- Mute
- Subscribe to RSS Feed
- Permalink
- Report Inappropriate Content
Dear all,
Thank you for your attention.
Running Arcmap 10.1.
I am brand new to this software and at this point I need this software to visualize the data generated from other program on the research basin.
At the moment I have a data set table in .csv which contains 603 columns. Column 1 for latitudes column 2 for longitudes, and column 3 to column 603 are data for each grid point(shown as black dots in figure 1) in 600 months. So basically my dataset is in format like this:
| y | x | month1 | month2 | month3 |
| 21.5 | 106.5 | 0.21064 | 0.070961 | 0.04823 |
| 21.5 | 107.5 | 0.11599 | 0.55193 | 0.6087 |
| 22.5 | 105.5 | 0.015563 | 0.016393 | 0.014246 |
| 22.5 | 106.5 | 0.034474 | 0.025667 | 0.002998 |
| 22.5 | 107.5 | 0.088733 | 0.71231 | 0.77644 |
There are 64 gird points and 600 months in total and each point is separated by 0.5 degrees,
I did tried to search topics like importing xyz data to arcmap and followed the instructions to add data and display xy data, but all i got is map below. I also tried to follow the Arctoolbox, but I failed at the very beginning when I tried to convert the file(Arctoolbox>3D Analyst Tools>Conversion>From File>ASCII 3D to Feature Class/Point File Information)
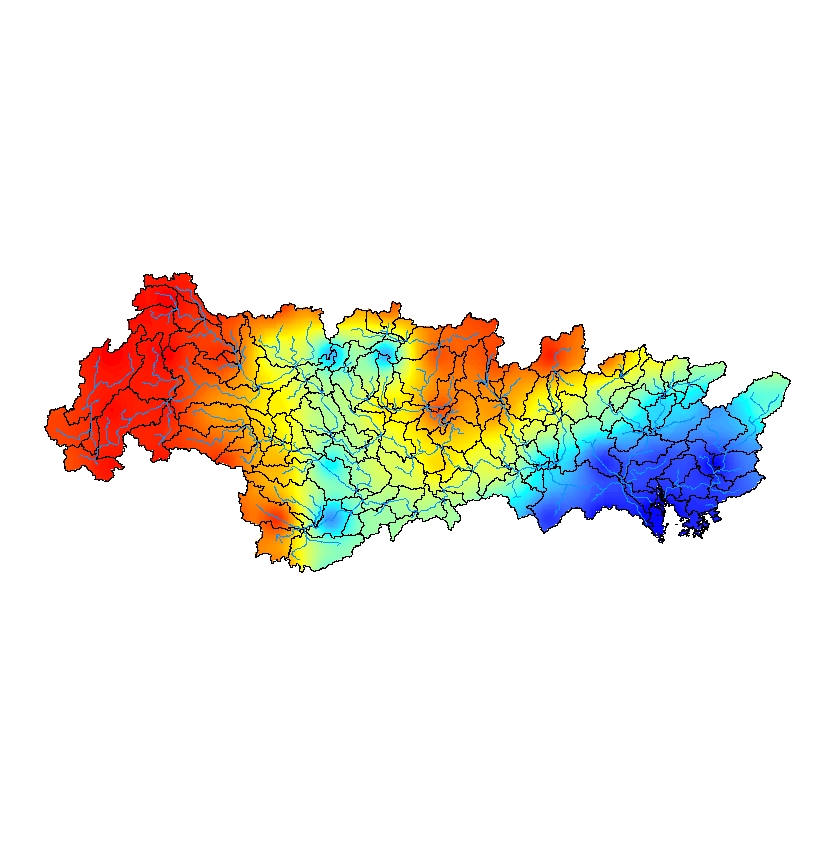
What I want in the end is plotting data on the map like I did in Matlab(shown in Figure 2) but in a shape more like a basin instead of mosaic one. And also in Matlab all the drawings(600 pics in this case) can be saved without doing it manually once the coding is right. Can I do this in Arcmap? I guess there is a more straightforward way to import this data and interpret it smoothly like meteorological application.
And another alternative I think is out of Arcmap and with the help of photoshop I may be able to "cut" colored area into a basin shape and batch processing in PS for 600 or even more pics. But I don't want to go to this stage really as I have this professional software that is well applied in meteorology aspect.
I do not come here if I never tried to learn and solve it by myself. Since I am totally new to this software, please don't mind if I have asked any stupid questions. 
thank you for your time and attention again.
looking forward to your answers.
Regards
figure 1: grid points and research basin:
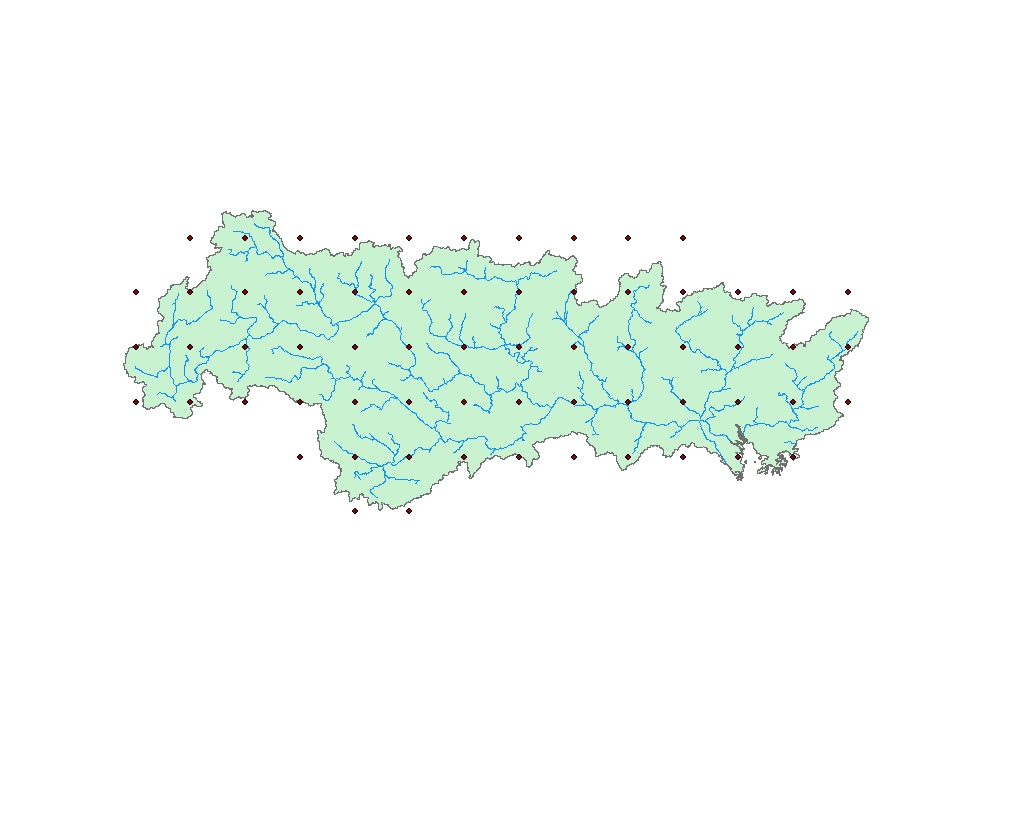
Figure 2: mapping using the column 3 data for same area in matlab(by interpolation to a finer resolution 0.25*0.25)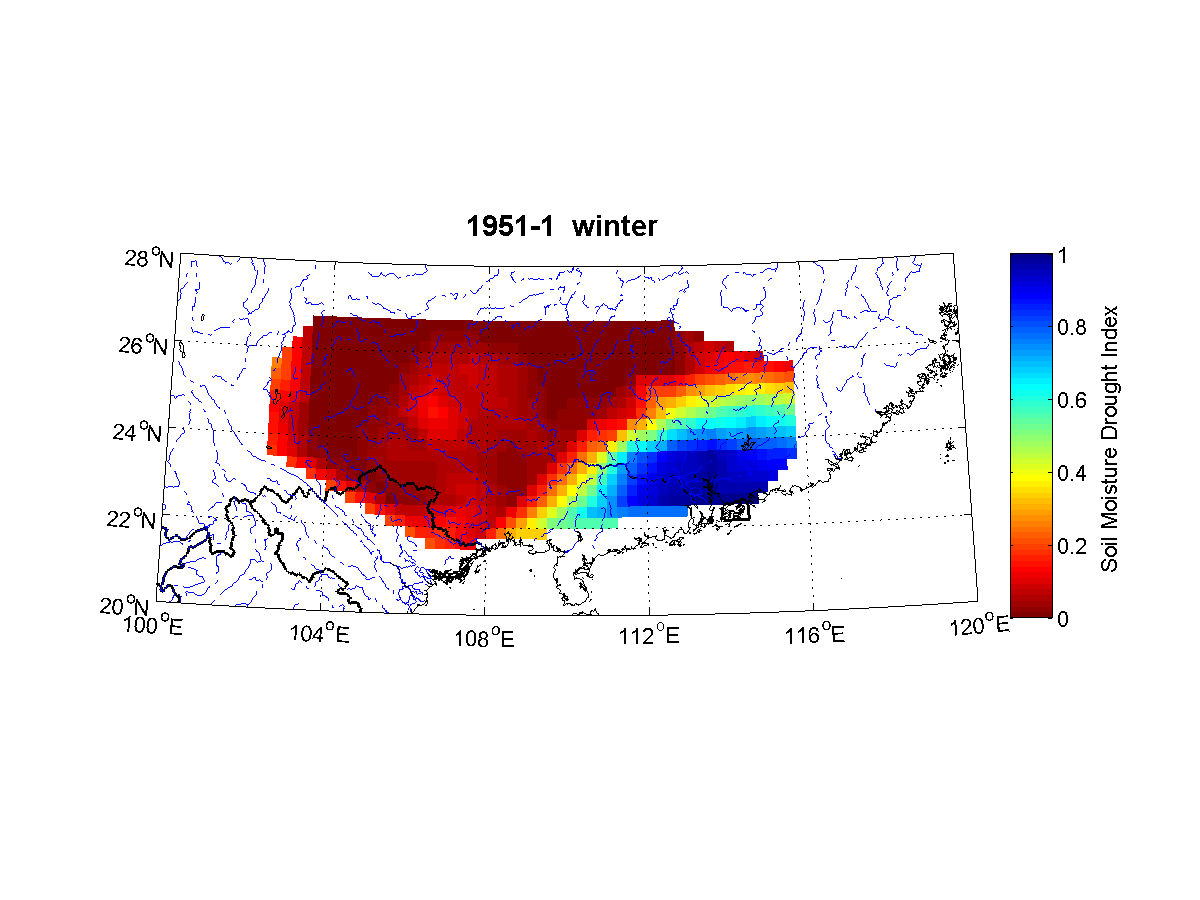
- Mark as New
- Bookmark
- Subscribe
- Mute
- Subscribe to RSS Feed
- Permalink
- Report Inappropriate Content
Think you take the first step to get the points into ArcMap. The second will be how to find the right tool to interpolate the data.
Maybe this could help you ...Hi, I am doing my thesis on spatial interpolation of meteorological data using GIS. I am using geost...
- Mark as New
- Bookmark
- Subscribe
- Mute
- Subscribe to RSS Feed
- Permalink
- Report Inappropriate Content
To Sol,
Thank you for your reply.
I have tried to follow your suggestion and successfully import my dataset to the file file geodatabase and add the data to a layer in Arcmap. But now I have got some problems to move on.
In Arctoolbox(3D Analyst Tools>Raster Interpolation), IDW for example, it requires the input to be a "feature" file. To settle this, I tried by right click the table converted and select "Create feature class from XY table" and left "Z field" to be <none>(shown in Fig 3).
This step generated a .shp file and I used that as the input in IDW where I can select Z values to be data for any single month(shown in Fig 4).
By clicking OK I got this Fig 5. And here are my problems:
*The interpolated area is defined by the rectangular edge of the sample data points, but I want this area to cover the whole basin shown in green, i.e., how can I extend the edge of the interpolation by a little bit to cover the whole basin?
*If I want to eliminate the color map of interpolation outside of the basin, what should I do?
*The procedure above only gave an interpolation for a single month, but in my project, there are over a thousand dataset. It is merely possible to plot them manually one by one. Is there a way for batch processing and then save every single picture by coding or whatever?
Fig 3:
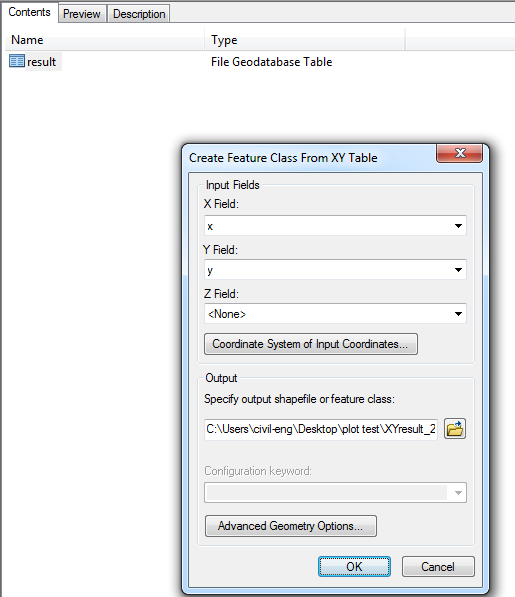
Fig 4:
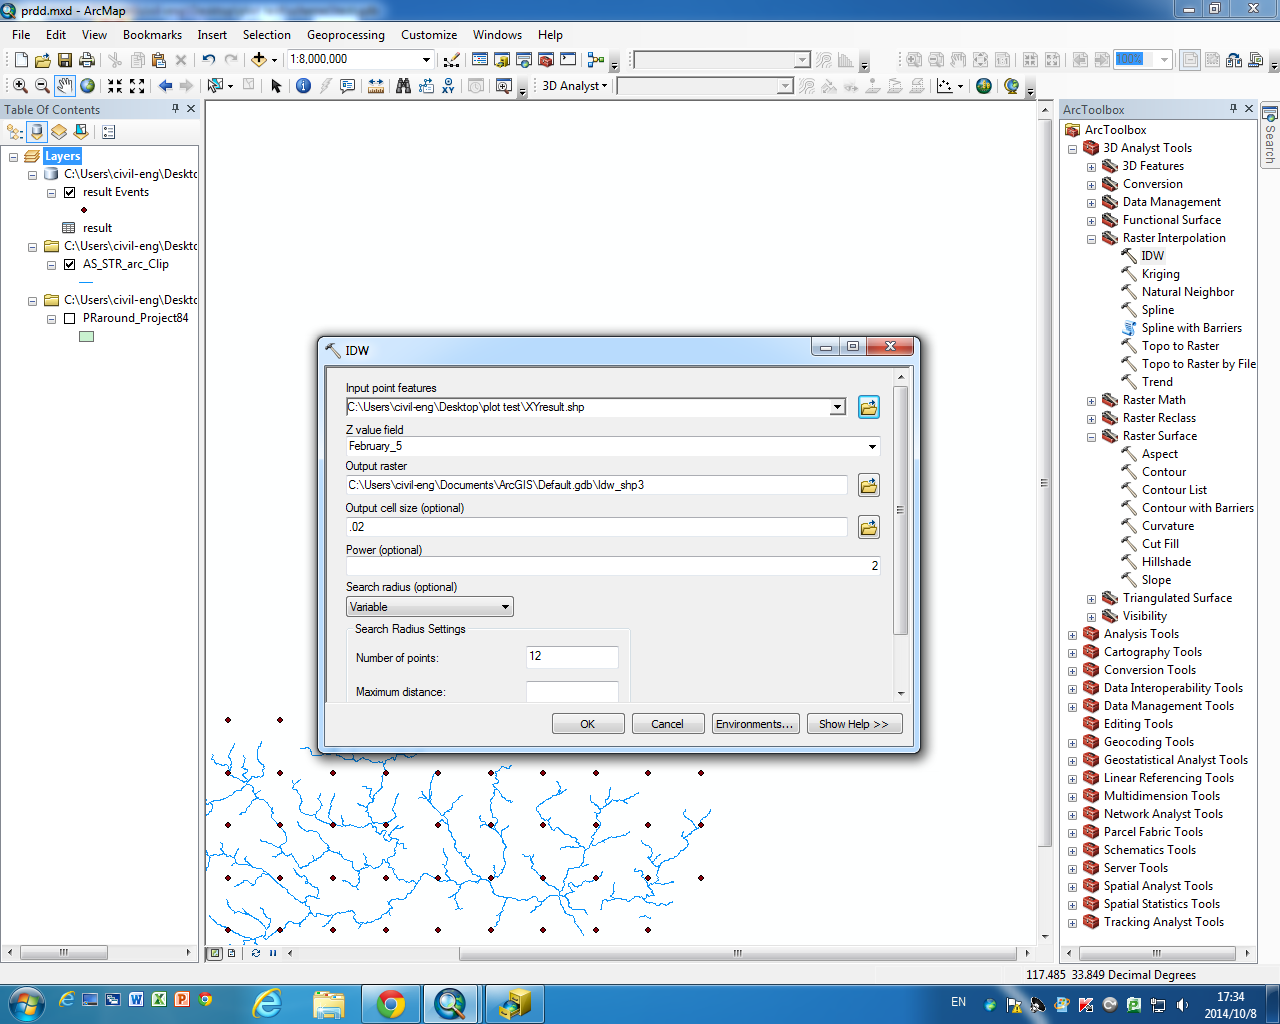
Fig 5:
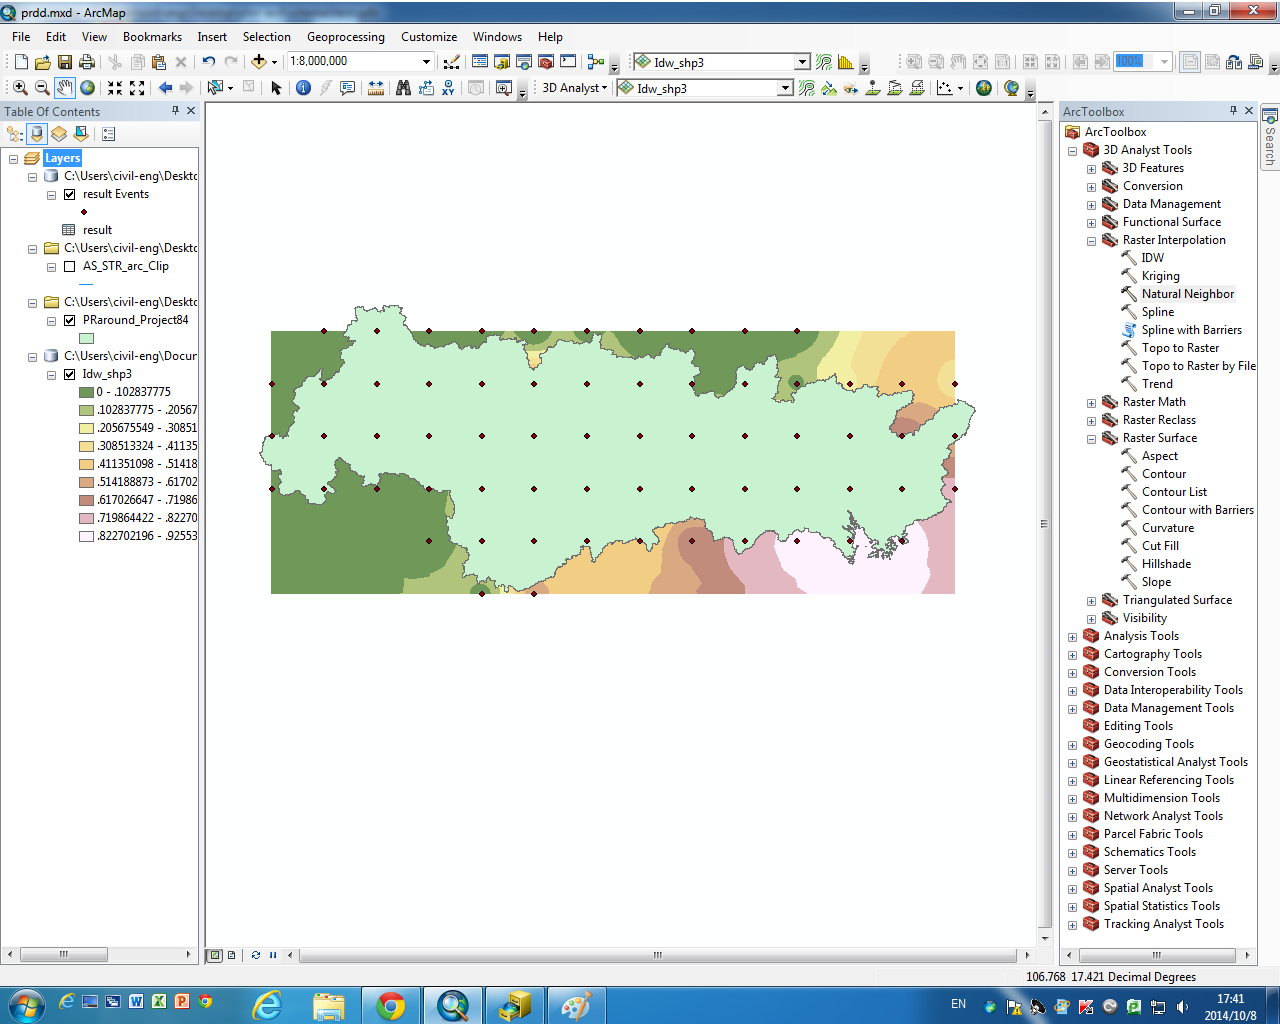
Fig 6: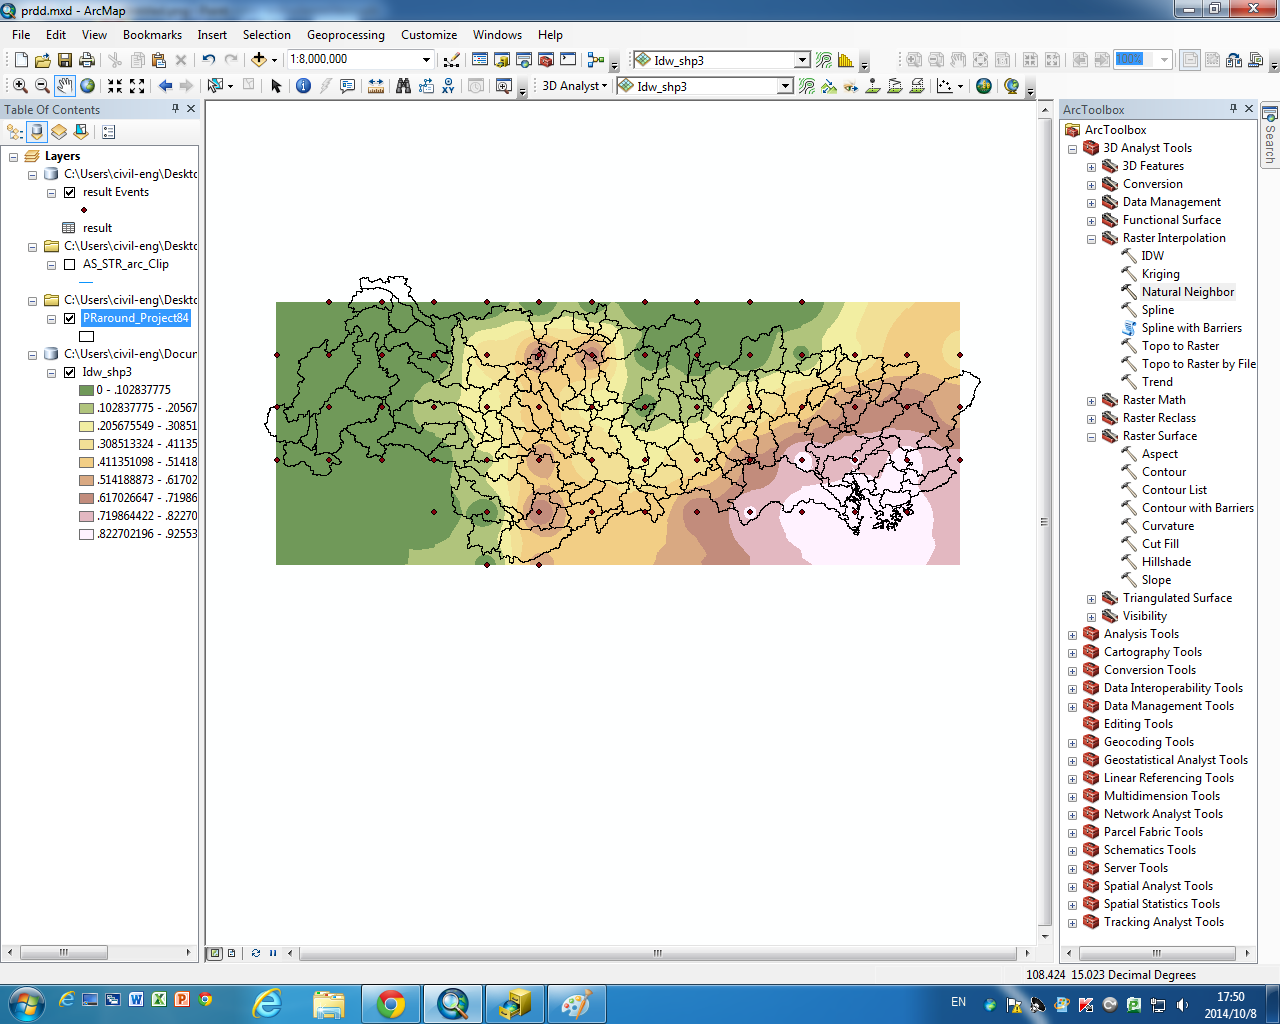
- Mark as New
- Bookmark
- Subscribe
- Mute
- Subscribe to RSS Feed
- Permalink
- Report Inappropriate Content
Hi Sol,
Thank you for your suggestion,
I will describe the procedure clearly for someone else having the same problem like me for a reference.
I tried the clipping tool, it failed, but it worked in extract by mask tool by selecting , it finally turned out like this:
The Batch process, however, does not seem to work properly. In the table after clicking the "Batch" button, in every row I have to specify the data one by one, which is barely possible in this case because I have hundreds of dataset(months). 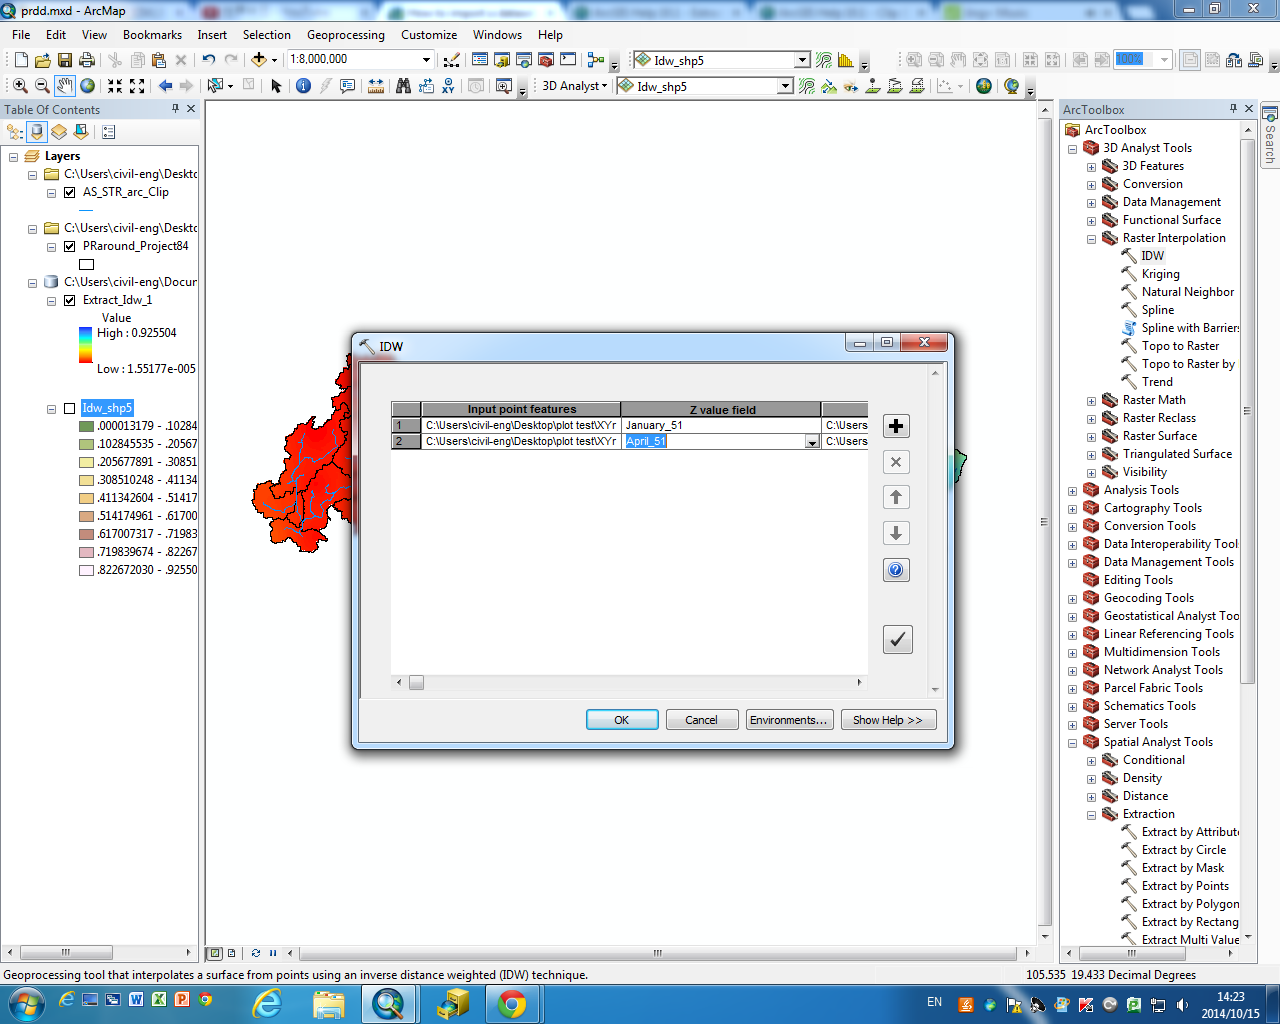
And the output of this batch process is not preferable, because it will draw different dataset(months) at the same time although in different layer. If I wanna look into a certain months, I have to unclick all the other months first. Could you please come up with a solution to this?
Thanks,
Joshua
- Mark as New
- Bookmark
- Subscribe
- Mute
- Subscribe to RSS Feed
- Permalink
- Report Inappropriate Content
Hi Sol,
It is me again, I have finished my project and I want to share my experiences about batch processing and animation of results, here is my link: An example of visualizing spatial-temporal data in the ArcMap
Thank you for your supports and hope this example can help others struggling similar problems.
Joshua