- Home
- :
- All Communities
- :
- Products
- :
- ArcGIS Business Analyst
- :
- ArcGIS Business Analyst Ideas
- :
- Business Analyst Infographic: Configure Multiple D...
- Subscribe to RSS Feed
- Mark as New
- Mark as Read
- Bookmark
- Follow this Idea
- Printer Friendly Page
- Report Inappropriate Content
Business Analyst Infographic: Configure Multiple Data Sources (COVID-19)
- Mark as New
- Bookmark
- Subscribe
- Mute
- Subscribe to RSS Feed
- Permalink
- Report Inappropriate Content
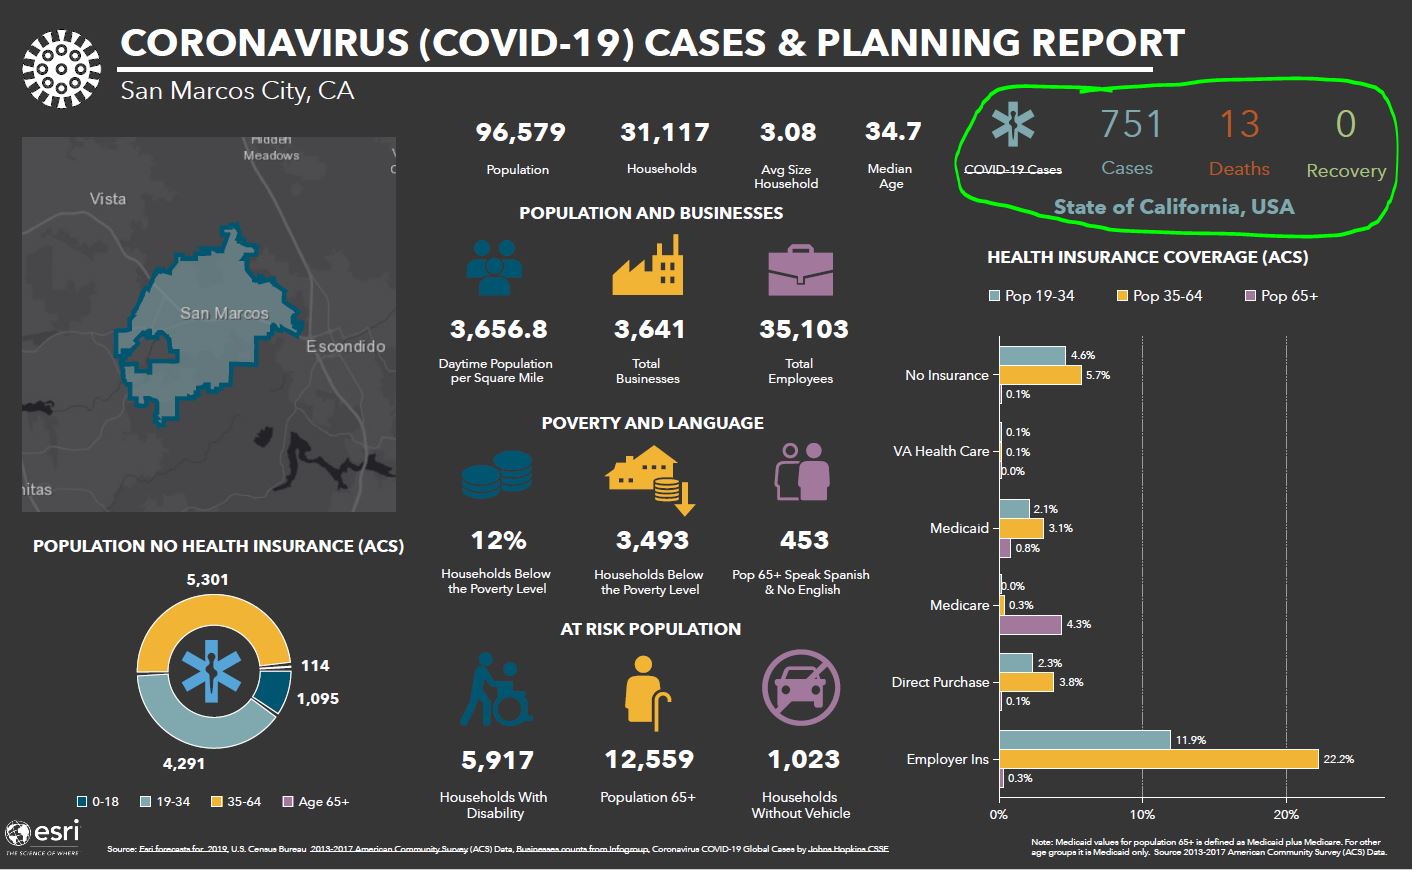
I generated an infographic as part of a local government response to the COVID-19 pandemic. It would be great to use demographics data for my municipality (city) and provide COVID-19 cases/deaths/recovery figures based on the most detailed geography available.
Esri did an amazing job providing templates and resources for public sector agencies to provide public information and resources in response to COVID-19. However, it would be very helpful to build some flexibility into the template as more detailed information becomes available. Manually added case information in image below - circled in green.
For example, only state-level data was available early on. We now have access to county-level data, which is a welcomed improvement. It would be great to see flexibility added to COVID-19 (and other) BAO infographic templates in future releases.
- Mark as Read
- Mark as New
- Bookmark
- Permalink
- Report Inappropriate Content
Hey @AlexSainz , Thanks for your note.
I know its been some time now but wanted to follow up quickly as some time has passed.
Can you share a little bit more about the limitations you hit and where they stand today, here are some follow up questions that would be helpful for us to dig in to this:
- Did you hit limitations customizing the Coronavirus Impact Planning infographic? If yes, please describe what blockers you ran into.
- Did you try using Custom Data Setup for the localized data to include in the infographic customization? If yes, let us know what issue ran into. If no, here's the documentation to get started on that path. (Recognizing this is manual and not dynamic)
- Were you looking for better access (live) to case data at multiple levels of geography directly?
You must be a registered user to add a comment. If you've already registered, sign in. Otherwise, register and sign in.