- Home
- :
- All Communities
- :
- Services
- :
- Esri Technical Support
- :
- Esri Technical Support Blog
- :
- Do Your Rasters Know What Time It Is?
Do Your Rasters Know What Time It Is?
- Subscribe to RSS Feed
- Mark as New
- Mark as Read
- Bookmark
- Subscribe
- Printer Friendly Page
- Report Inappropriate Content
Viewing a series of rasters according to a timeline usually ends with turning on/off the layers to produce the desired visual affect. This process, along with many other techniques for looking at data over time, has been fairly challenging.
In ArcGIS 10, the ability to time-enable spatial data has opened a whole new dimension to the visualization of information.
Imagery, temperature and precipitation are just a few examples that can be placed into a mosaic dataset or raster catalog to represent a change over time. The following example enables time on a mosaic dataset. However, similar steps can be followed to activate time on a raster catalog.
Preparing your data:
1. Create a new mosaic dataset and add in the rasters.
(For detailed steps see: The workflow and tools to create mosaic datasets)
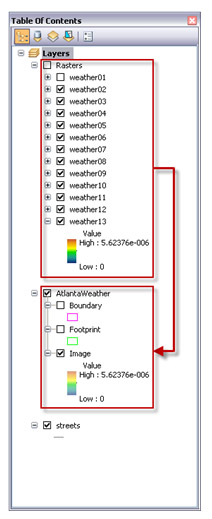
2. Open the attribute table of the mosaic dataset footprint.
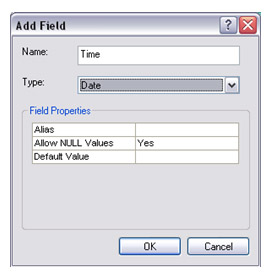
3. Add a new ‘date' type field.
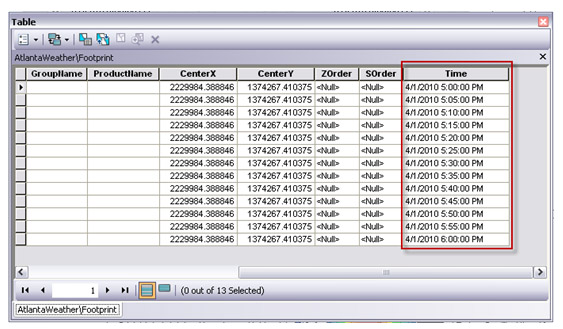
4. Populate the field with the corresponding time values.
Enabling time on your data:
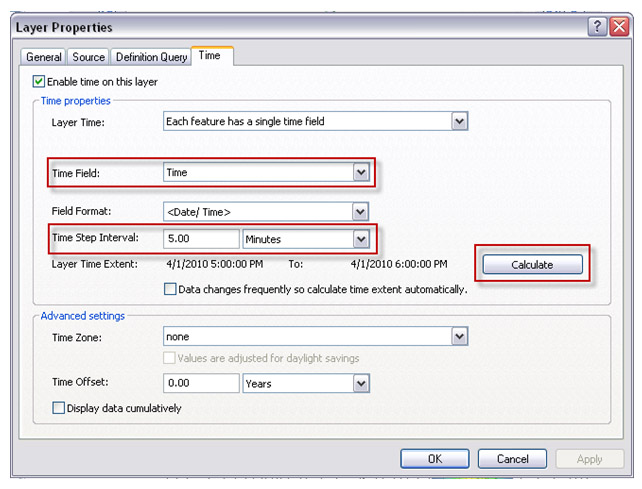
1. Right-click on the mosaic dataset in ArcMap > Properties > Time tab.
2. Select the Time Field.
3. Click Calculate to populate the time step interval and the layer time extent.
4. Adjust the time step interval to the desired value.
5. Click OK.
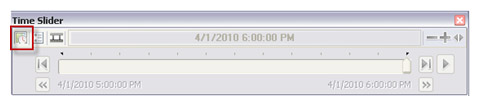
6. Open the Time Slider window from the Tools toolbar.
![]()
7. Enable time on map from the Time Slider window.
8. Use the time slider to step through each raster in the mosaic dataset.
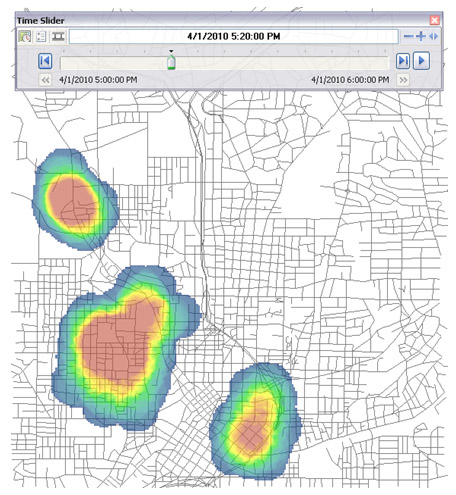
Now with time enabled functionality, your rasters can know what time it is and provide you with an excellent option for visualizing data changes over time.
-Timothy H., Support Analyst - Geodata Raster Group, Esri Support Services - Charlotte, NC
Related Links:
How time is supported in spatial data
You must be a registered user to add a comment. If you've already registered, sign in. Otherwise, register and sign in.
-
Announcements
70 -
ArcGIS Desktop
87 -
ArcGIS Enterprise
43 -
ArcGIS Mobile
7 -
ArcGIS Online
22 -
ArcGIS Pro
14 -
ArcPad
4 -
ArcSDE
16 -
CityEngine
9 -
Geodatabase
25 -
High Priority
9 -
Location Analytics
4 -
People
3 -
Raster
17 -
SDK
29 -
Support
3 -
Support.Esri.com
60
- « Previous
- Next »