- Home
- :
- All Communities
- :
- ArcGIS Topics
- :
- Applications Prototype Lab
- :
- Applications Prototype Lab Blog
- :
- Spider Diagram Geoprocessing Tool
Spider Diagram Geoprocessing Tool
- Subscribe to RSS Feed
- Mark as New
- Mark as Read
- Bookmark
- Subscribe
- Printer Friendly Page
- Report Inappropriate Content
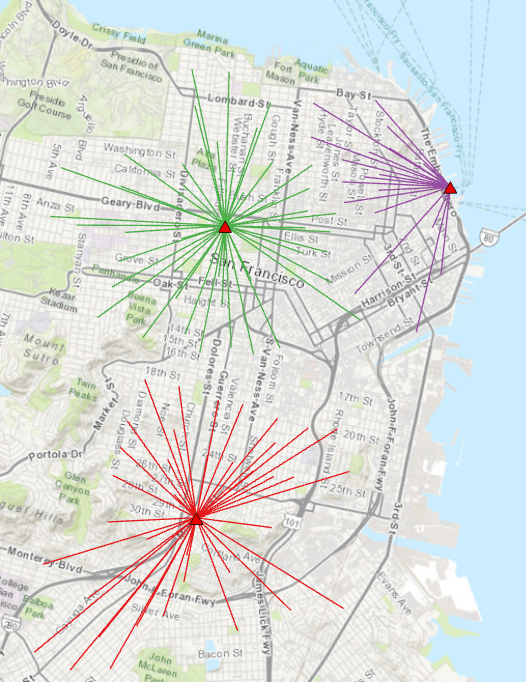
The map above shows some spider diagrams. These diagrams are useful for presenting spatial distribution, for example, customers for a retail outlet or the hometowns of university students. The lab was recently tasked with creating an automated spider diagram tool without using Business Analyst or Network Analyst. The result of our work is in the Spider Diagram Toolbox for use by either ArcGIS Pro or ArcGIS Desktop.
Installation is fairly straight forward. After downloading the zip file, decompress and place the following files on your desktop.:
- SpiderDiagram.pyt,
- SpiderDiagram.pyt.xml,
- SpiderDiagram.Spider.pyt.xml, and
- SpiderDiagramReadme.pdf
In ArcGIS PRO or ArcMap you may connect a folder to this the desktop folder so that you access these files.
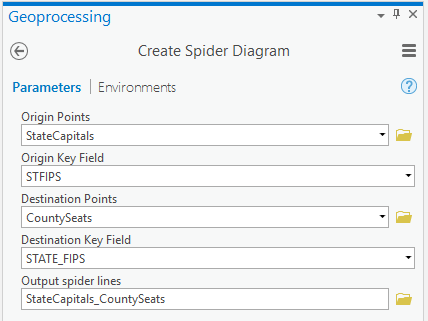
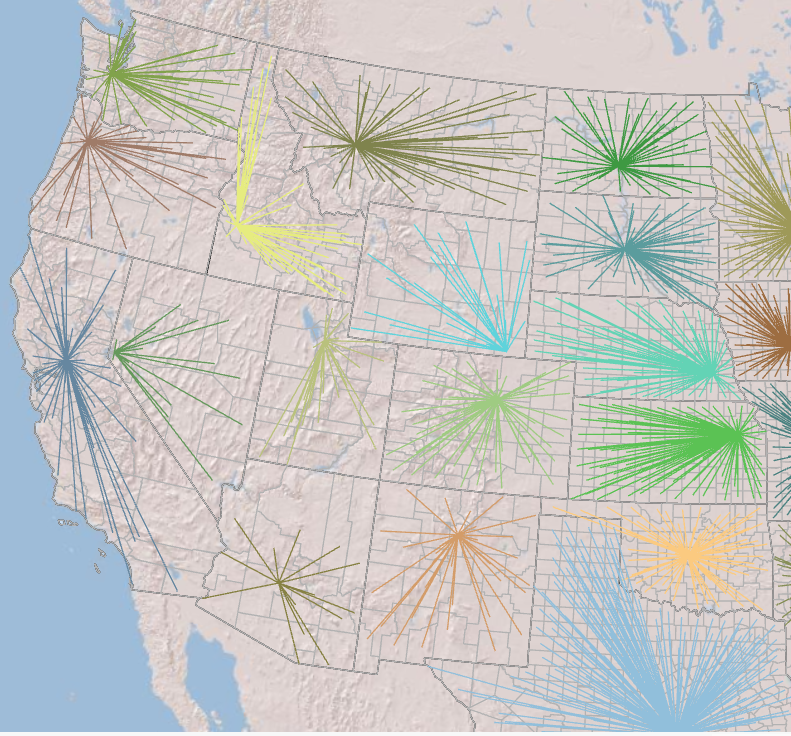
Running the tool is also easy. The tool dialog will prompt you for the origin and destination feature classes as well as the optional key fields that will link destination points to origin points. In the example below, the county seats are related to state capitals by the FIPS code.
Result:
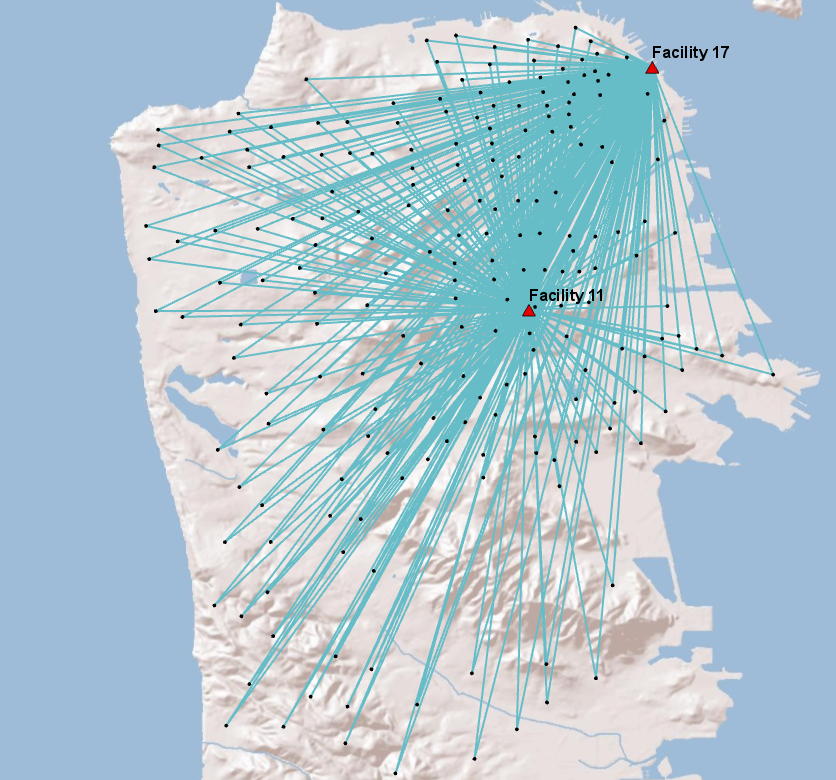
Leave one or both key fields blank to connect each origin point to every destination point.

Result:
Which is the origin and which is the destination feature class? It really doesn’t matter for this tool – either way will work. If you want to symbolize the result with an arrow line symbol, know that the start point of each line is the location of points in the origin feature class.
Script and article written by Mark Smith.
Please direct comments to bgerlt-esristaff.
You must be a registered user to add a comment. If you've already registered, sign in. Otherwise, register and sign in.