- Home
- :
- All Communities
- :
- ArcGIS Topics
- :
- Applications Prototype Lab
- :
- Applications Prototype Lab Blog
- :
- Centrality Analysis Toolbox
Centrality Analysis Toolbox
- Subscribe to RSS Feed
- Mark as New
- Mark as Read
- Bookmark
- Subscribe
- Printer Friendly Page
- Report Inappropriate Content
The graph theory concept of Centrality has gained popularity in recent years as a way to gain insight into network behavior. In graph or network theory, Centrality measures are used to determine the relative importance of a vertex or edge within the overall network. There are many types of centrality. Betweenness centrality measures how often a node or edge lies along the optimum path between all other nodes in the network. A high betweenness centrality value indicates a critical role in network connectivity. Because there are currently no Centrality tools in ArcGIS, I created a simple ArcGIS Pro 2.1 GP toolbox that uses the NetworkX Python library to make these types of analyses easy to incorporate in ArcGIS workflows.
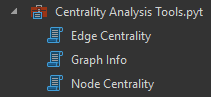
Figure 1 Centrality Analysis Tools (CAT)
The terms network and graph will be used interchangeably in this blog. Here, network does not refer to an ArcGIS Network dataset. It simply means a set of node objects connected by edges. In ArcGIS these nodes might be points, polygons or maybe even other lines. The edges can be thought of as the polylines that connect two nodes. The network could also be raster regions connected by polylines traversing a cost surface using Cost Connectivity.
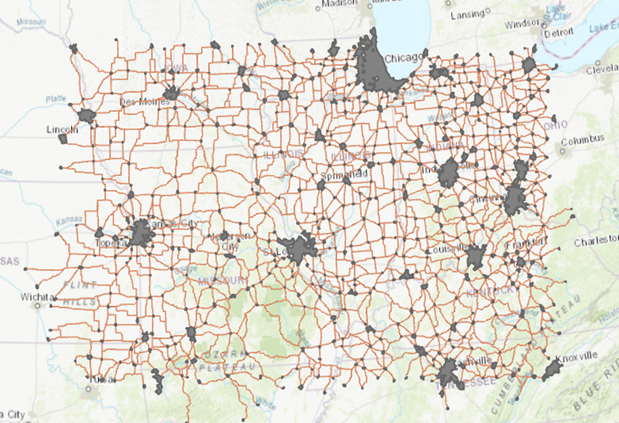
Figure 2 A few mid-western urban areas connected by major roads. Cost Connectivity was used to find
"natural" neighbors and connect the towns via the road network.
As it turns out, the output from Cost Connectivity (CC) is perfect input for the Centrality Analysis tools. Let’s take a look at the CC output table.
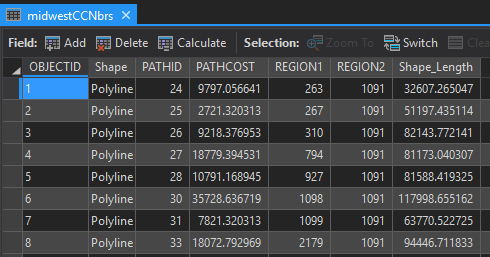
Figure 3 Cost Connectivity output with "out_neighbors_paths" option selected.
Now let’s see how this lines up with CAT Node Centrality input parameters.
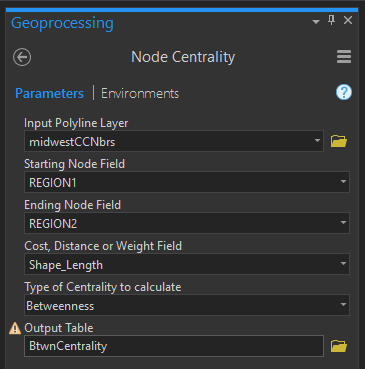
Figure 4 Node Centrality tool parameters
There are a couple things worth mentioning here. The Starting Node Field and Ending Node Field do not indicate directionality. In fact, the tool assumes cost is the same to move in either direction. I used Shape_Length but could have used PathCost or some other field indicating the cost to move from node to node. This table and its associated feature class are created by Cost Connectivity when you select the “out_neighbor_paths” option. While the minimum spanning tree option will work, the Neighbor output seems more reasonable for centrality analysis. It is also important to make sure you do not have links in your graph that connect a node to itself and that all link costs are greater than zero.
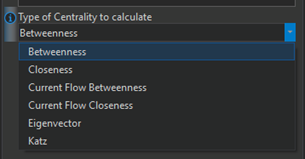
Figure 5 Options for Node Centrality type
Both the Node and Edge Centrality tools require “connected” graphs, which means all the nodes in the graph must be connected to the rest of the network. If you have nodes that are not connected or reachable by all the other nodes, some functions will not work. This can happen when you have nodes on islands that are unreachable for some reason. If this happens, you will have to either make a connection and give it a really high cost or remove those nodes from the analysis.
Because these tools require some specific input, I included a Graph Info tool so that users could get information about the size and connectedness of their input data before trying to run either the Node or Edge centrality tools.
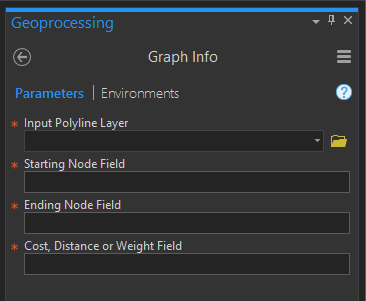
Figure 6 Graph Info tool provides critical information about potential input
data without having to run one of the tools first.
One last thing to keep in mind -- many of the centrality measures available within these tools require the optimum path between all nodes in the network to be calculated. This is quite compute intensive, and execution time and computer resource requirements grow exponentially. It is best to try the tool out on a fairly small network of 1000 nodes and maybe 5000 connectors before trying to run on larger datasets, just to get a feel for time and resource requirements. The example shown above runs in less than five seconds but there are only 587 nodes and 1469 connectors.
Please download the toolbox, try it out, and let me know what you think. I would like to hear about your use cases.
You must be a registered user to add a comment. If you've already registered, sign in. Otherwise, register and sign in.