- Home
- :
- All Communities
- :
- Industries
- :
- Public Safety
- :
- Public Safety Blog
- :
- Data Analysis for the Fire Service and EMS
Data Analysis for the Fire Service and EMS
- Subscribe to RSS Feed
- Mark as New
- Mark as Read
- Bookmark
- Subscribe
- Printer Friendly Page
- Report Inappropriate Content
By Mike Cox, Esri Fire and EMS Industry Manager
Responders make critical decisions based on limited information every day. Agencies should strive to generate verified data for emergency and nonemergency needs to provide responders with the right data at the right time. Fire and emergency medical services (EMS) departments generate a large amount of data that can be used to identify emerging threats, monitor performance measures, and develop resource deployment models based on verifiable intelligence.
Modern challenges require modern solutions. Agencies and organizations need tools and operational capabilities to adapt to fluid risks and to support a variety of mission requirements. Today, we must be able to identify threats, collaborate and unify operations, respond rapidly to events, communicate with the public, and analyze the success of those efforts. Through the power of geospatial technology, organizations can now adopt a smarter, more integrative approach to safety and security. With the right technology, data, people, and processes, every community can become a safe community.
The demands on agencies—ranging from aging populations to the increasing severity and frequency of the events to which we must respond—are becoming greater. The role of public safety is changing as we strive to keep our communities livable. The health of a community depends on the effective operation of its public safety agencies, and geographic information system (GIS) technology can improve that effectiveness.
We can use GIS to analyze and measure data and share it with decision-makers. This data can come from computer-aided dispatch (CAD) software, records management systems (RMS), community risk reduction (CRR) activities, or nearly any data source that's deemed appropriate by the agency.

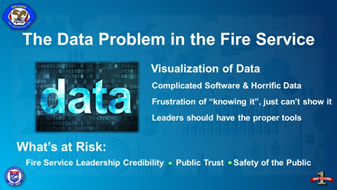
The issue in public safety is to determine how we use this data. How do we visualize it? How do we communicate it? Problems arise because the data can be incorrectly collected. Software changes, proprietary vendor policies, and agency guidelines can obstruct the use of data. Software can be complicated, and visualization can be cumbersome. These problems can disrupt the use of the data by leaders.
GIS can help users overcome these obstacles. Agencies can develop plans and processes for collecting, measuring, and analyzing pertinent data to support their operations.
There is often a communication gap between fire service leadership and GIS personnel. Of course, we are all searching for safe solutions for our customers and public safety personnel. We must bridge the gap between data and where it can be used to make good decisions.
GIS is the tool to bridge that gap. GIS directly impacts how well we collect, measure, and analyze data and supports the credibility of leaders and the organization. Using data analysis and communicating its results to your personnel, elected officials, and the public can impact the long-term health of your organization. The ability to tell the organization's story will affect staffing, fleets, station construction, and fiscal decisions.
The accreditation process is a perfect example of the appropriate use of data. As defined by the Center for Public Safety Excellence (CPSE), accreditation is "an all-hazard, quality improvement model based on risk analysis and self-assessment that promotes the establishment of community-adopted performance targets for fire and emergency service agencies." This model of continual improvement depends heavily on the collection and analysis of data.
Public safety personnel are continually analyzing data. Every response generates data for after-action reports, performance measures, and the identification of successful outcomes. These reviews can be supported using GIS. The benefits of using GIS data to measure performance and focus resources can be wide-ranging. These benefits include the following:
- Identification of populations at risk—A community risk assessment (CRA), performed for the accreditation process and for risk reduction programs, can identify high-risk occupancies (target hazards), at-risk populations, and areas of the community where there should be public education and prevention programs.
- Increased responder safety—Through a CRA, preplanning efforts can be focused on the highest-risk occupancies. Responders can identify these hazards before the response. GIS allows agencies to use a visual product to share these assessments efficiently with anyone deemed appropriate. These plans can be communicated in near real time as they are generated or updated.
- Support for the budgetary process—Gone are the days of anecdotal presentations to justify expenditures. Elected officials and the community no longer want decisions based on gut feelings. With GIS, data can be presented in a way that easily identifies gaps in service delivery, local at-risk areas, and the impact of growth on a community. These stories can be communicated to elected leaders to justify the investment of public funding in the agency.
To effectively analyze data, your agency must do three things:
- Identify what decisions must be made and ensure that your agency's data supports these decisions. This data can include tax parcel, road network, demographic, RMS, CAD, and CRR information. Consider what data the agency would want in a visual product that would help staff make decisions. RMS and CAD data is typically easily consumed by GIS to generate visual products.
- Use available off-the-shelf solutions to analyze data by location, time, and performance. Is the agency meeting effective response force (ERF) objectives? What areas of the community have service delivery gaps?
- Visualize the information and share it with the appropriate decision-makers. Agencies will be able to determine if the department is meeting performance objectives. Decision-makers can determine where these performance gaps are so that resources can be appropriately deployed.

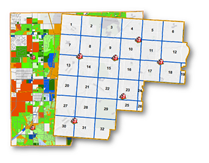
The accreditation process requires the use of planning zones, which can be easily designated as the agency prefers. These zones can be created in geographic measurements, such as a square mile; by first-due responders' or other individuals' resource areas of responsibility; or—using the most comprehensive approach, after performing a focused risk assessment—at a very granular address point for every occupancy in a jurisdiction.
We need a CRA to understand the community we serve. These assessments not only identify risk but also highlight the characteristics of the population and infrastructure that impact response daily. The data available for the CRA is from the agency and outside sources. This data can include demographics, occupancy types, water systems, target hazards, floodplains, and critical infrastructure that can be identified and presented with GIS. Your agency can use this assessment to focus efforts on continual improvement and reduce the risk for your community, and then use GIS to efficiently manage that risk reduction effort.
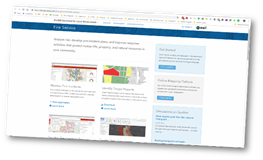
Drive-time analysis, 90th percentile data visualization, and the presentation of high-risk areas can all be performed with GIS. Off-the-shelf templates support the agency's data analysis. Use templates for direction on how to automate the data you import into your solutions. These solutions are configurable and very flexible. You decide what data is used, how to view it, and who can access it.
Visit: solutions.arcgis.com/local-government/fire-service/
Now this data can help your agency become more efficient and reduce risk for responders and the community. These solutions are not complicated and provide the appropriate tools to decision-makers, from frontline personnel to the agency executives. These solutions provide leaders with the tools for making decisions to increase responder safety, reduce response times, and provide an environment of continual improvement.
References
Esri: esri.com
CPSE: https://cpse.org/
Vision 20/20: http://www.strategicfire.org
Orland Fire Protection District: www.orlandfire.org
Orland Fire GIS: Steve Rivero, Engineer s.rivero@orlandfire.org
Esri: Mike Cox, Fire and EMS Industry Manager Mike_Cox@esri.com
You must be a registered user to add a comment. If you've already registered, sign in. Otherwise, register and sign in.