- Home
- :
- All Communities
- :
- Products
- :
- ArcGIS Online
- :
- ArcGIS Online Blog
- :
- So you want to display a Bazillion Features on the...
So you want to display a Bazillion Features on the Web? A Technical Approach to Large Feature Datasets
- Subscribe to RSS Feed
- Mark as New
- Mark as Read
- Bookmark
- Subscribe
- Printer Friendly Page
- Report Inappropriate Content
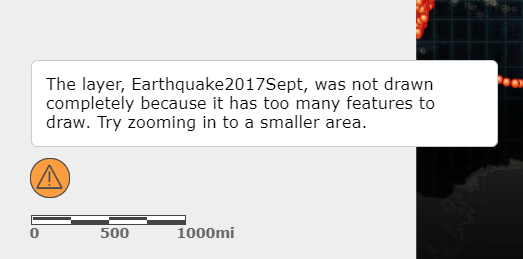
You can display hundreds, thousands, tens of thousands, and bazillions of features in interactive web maps and apps using ArcGIS . This blog explains technical details about how Map Viewer and Web Apps interact with feature services. Sometimes when large datasets are displayed in their entirety, they can become visually confusing or stop performing optimally. When a feature layer stops performing optimally, an orange exclamation mark displays in the bottom-left corner of Map Viewer, indicating that the “layer did not completely draw”.
Uncle Ben Parker (Spiderman) once said, “With great power comes great responsibility.” Keep this in mind when creating maps and apps with large datasets. Although it is possible to show as many features as you have in a web map, consider the map reader and the strategies outlined in this blog for displaying large datasets in creating the most appropriate information product.
Let’s get technical
Map Viewer and ArcGIS web apps request data from the feature layers that result in efficient display of features. Map Viewer determines whether to request all of the features in small feature services in a single request (Snap Shot Mode) or to make many small requests to the same service (On-Demand Mode) for larger feature services.
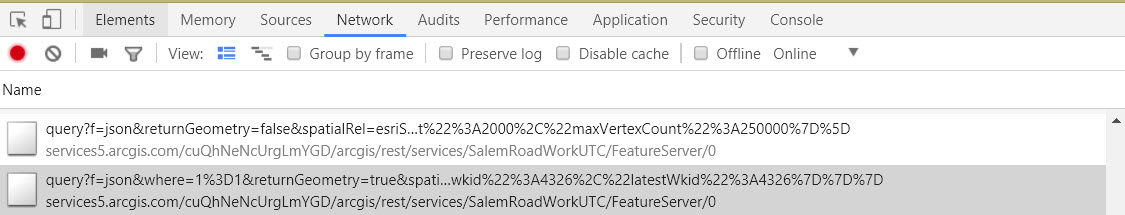
When a feature layer is initially requested, the web map sends a query request specifying outStatistics to verify whether the layer has more than 2000 polygons, 4000 points, or 250,000 vertices. If the limits are exceeded (value of 1), On-Demand Mode is used. (For a refresher in monitoring web requests, check out this blog: https://community.esri.com/groups/cats/blog/2017/05/04/monitoring-web-service-requests-from-web-apps)
When On-Demand Mode is used to request features from a feature service, the web map divides the map into a virtual tiling scheme and makes individual requests for specific extents within the web map. This results in individual requests being sent for each tile extent determined within the map. Each request can have a maximum number of points returned. This value is different depending on the source of the feature layer. By default, hosted feature services can have a maximum of 8,000 points returned by the server efficiently, and1000 points for ArcGIS Server services. If one of the virtual tiles exceeds this limit, the orange exclamation mark appears in Map Viewer.
This map shows the 4 virtual tiles that were used to query this Web App of earthquakes in 2017, which has 15,284 features. No virtual tile requests exceed 8,000 points, thus no error message appears and all of the features are displayed.
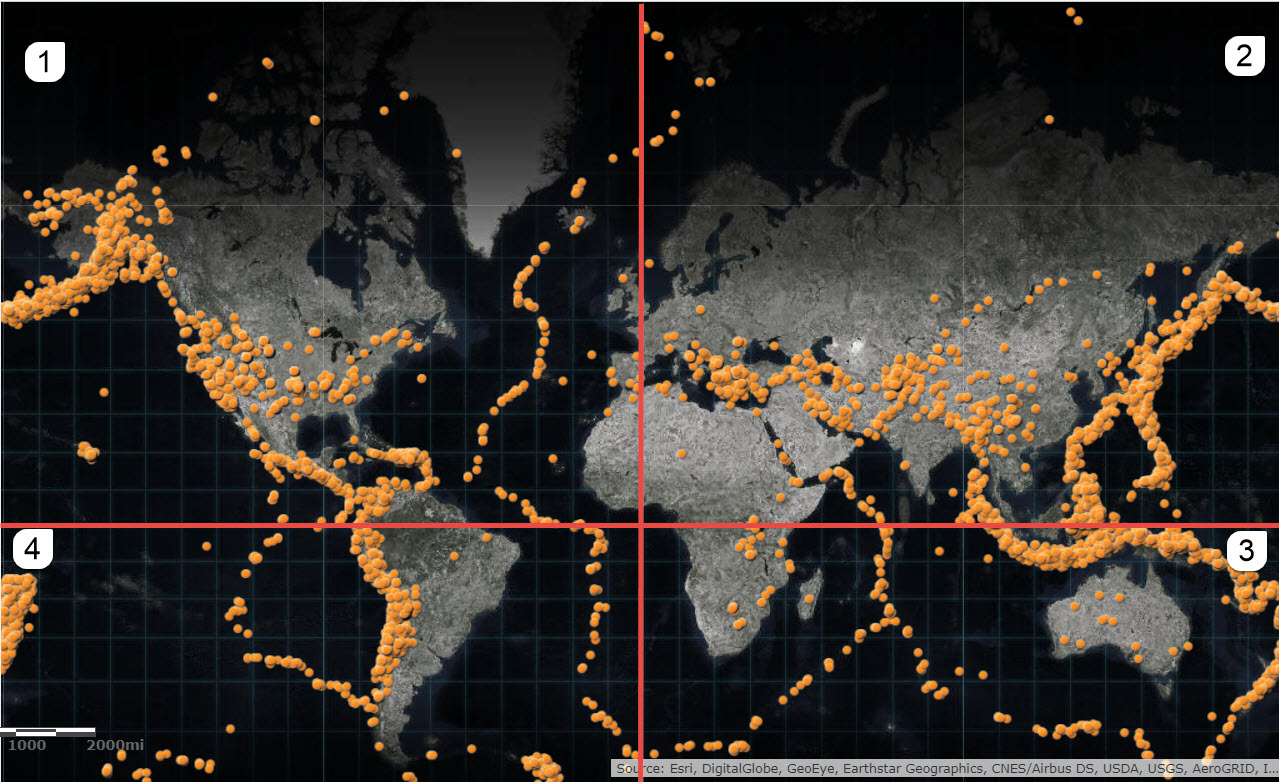
- Geometry: -20037508.342788905, 0.000004857778549194336, 0.000004857778549194336,20037508.342788905 , Request, Points Returned: 7763
- Geometry: -0.000004857778549194336, 0.000004857778549194336, 20037508.34277919,20037508.342788905, Request. Points Returned: 3085
- Geometry: -0.000004857778549194336, -20037508.34277919, 20037508.34277919, 0.000004857778549194336, Request, Points Returned: 2135
- Geometry: -20037508.342788905, -20037508.34277919, -0.000004857778549194336, 0.000004857778549194336 Request, Points Returned: 2301
This web map shows the 4 virtual tiles that were used to query this Web App of earthquakes between 2014 and 2017, which has 95,039 features (not quite a bazillion, but you get the point). As each virtual tile returns more than 8,000 features, the orange exclamation mark appears and 8,000 features are displayed per virtual tile.
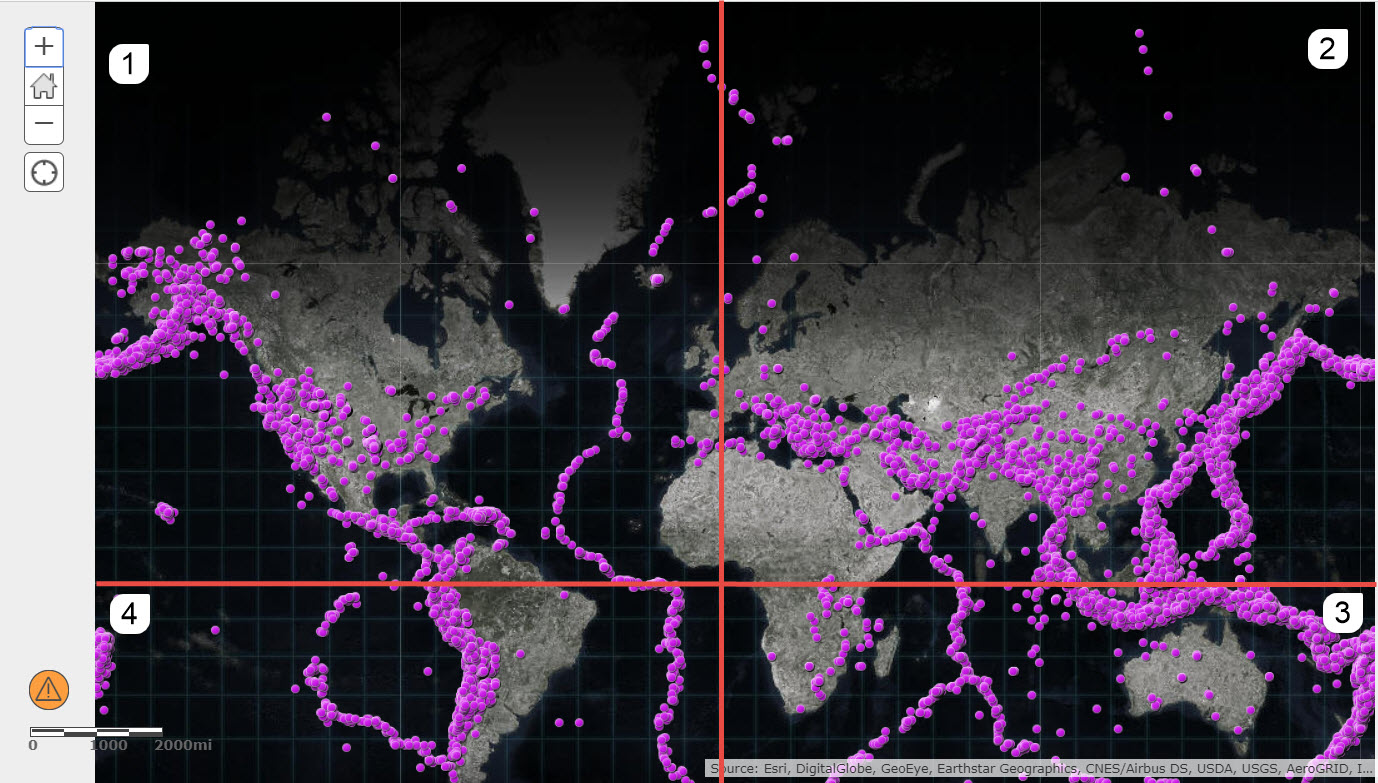
- Geometry: -20037508.342788905, 0.000004857778549194336, 0.000004857778549194336,20037508.342788905 , Request, Points Returned: 8000
- Geometry: -0.000004857778549194336, 0.000004857778549194336, 20037508.34277919,20037508.342788905, Request, Points Returned: 8000
- Geometry: -0.000004857778549194336, -20037508.34277919, 20037508.34277919, 0.000004857778549194336, Request, Points Returned: 8000
- Geometry: -20037508.342788905, -20037508.34277919, -0.000004857778549194336, 0.000004857778549194336 Request, Points Returned: 8000
Preventing the Warning
When exclamation mark indicating the layer was not completely drawn is displayed, there are two methods to ensure that all of the data draws without the error.
- Set up your map so that requests to the feature service won’t exceed the limits of the feature layer. You can reduce the amount of data requested in on demand mode by setting the visible scale range or applying filters.
- If you need to display a large number of features that exceeds the request limits described above, use a tiled service. This will result in a performant layer that visually displays all of the data using pre-rendered image format.
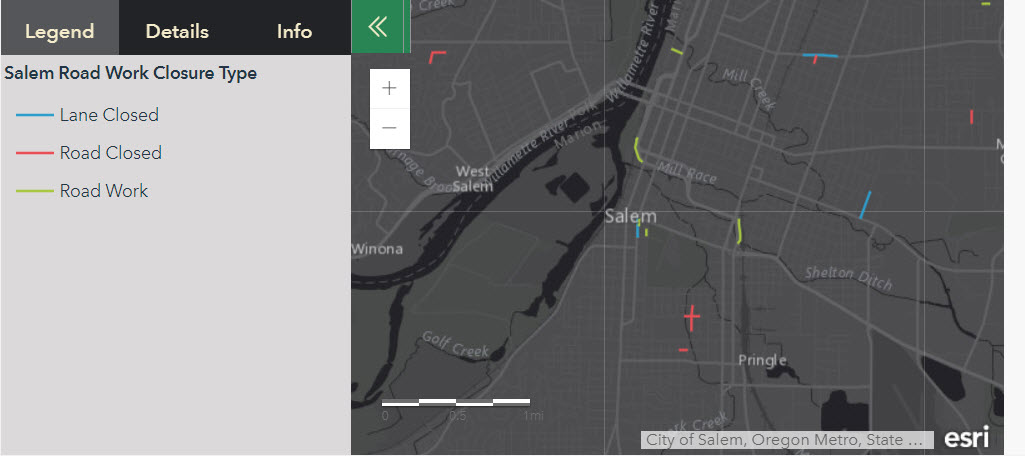
This application displays the same data as a feature service (right) and a tile service (left). Both look very similar but you will notice the drawing performance speed is much faster in the tile service (left). With a keen eye, you can also notice that the tile layer has more features (West Coast of Greenland). Although tile service allows all of the data to draw without error, is it the best way to show large numbers of features for your audience. Check out the companion blog for Strategies for Displaying Large amounts of data.
Additional Notes about Layer Drawing Warning:
- When the layer drawing error displays, an incomplete set of the data is drawn in the web map. Additionally, the error message is suppressed in web applications, therefore your users may be unaware that only part of the dataset is displayed.
- The warning will also display if there is an error in the response from the service. It you receive an error and not features are drawn, monitor the web requests to investigate the issue further.
You must be a registered user to add a comment. If you've already registered, sign in. Otherwise, register and sign in.