- Home
- :
- All Communities
- :
- Products
- :
- ArcGIS Spatial Analyst
- :
- ArcGIS Spatial Analyst Blog
- :
- Using interactive features with Spatial Analyst to...
Using interactive features with Spatial Analyst tools
- Subscribe to RSS Feed
- Mark as New
- Mark as Read
- Bookmark
- Subscribe
- Printer Friendly Page
- Report Inappropriate Content
Have you tried the new Interactive feature input capability in ArcGIS Pro 2.0 yet? Read on to learn more about how you can perform analysis interactively with some of the Spatial Analyst tools.
Interactive feature input has been added to a number of geoprocessing tools in ArcGIS Pro 2.0, including certain Spatial Analyst tools that can process feature data. Depending on the type of features supported by a particular tool, you have the option to interactively create points, lines, polygons or 3D multipatches. This cool functionality lets you draw input features interactively on the map, and these features then become inputs to your tool.
Let’s go through an example to see how we can create polygon zones to summarize a raster using the Zonal Statistics as Table tool.
With the tool dialog box open, start by clicking the pencil, then select Polygons from the drop-down.
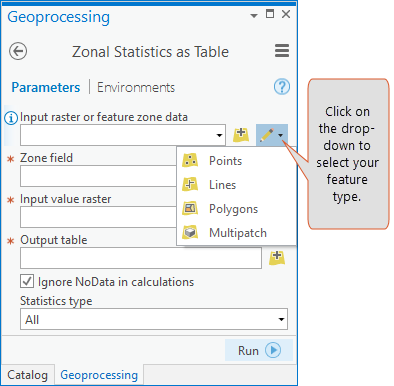
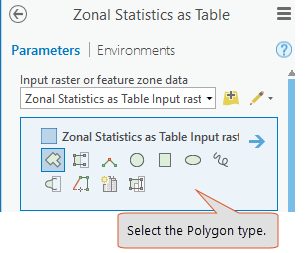
Once you select Polygons, a default polygon drawing tool will be activated and you can start drawing the polygon on the map, or you can choose from a palette of different editing tool used to digitize a polygon, including irregular polygons, autocomplete polygons, right-angle polygons, circles, squares, etc.
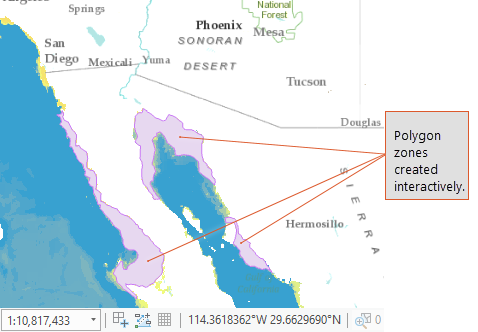
Now start drawing the features. For this example, I am comparing Seafloor Dissolved Oxygen (ml/l) at the coastline on both sides of the Gulf of California, and I have chosen the free shape polygon to digitize the zones.
After you finish drawing the polygons on the map, clear selection from the last created feature. Go to the Edit ribbon, select Clear. If you do not clear the selection, the analysis will run only on the last selected feature.
For Zonal Statistics as Table, we need an attribute to uniquely identify each zone. Open the attribute table of the zone polygon layer you just created. You will notice that it already comes with some default fields of different types. We are going to use the ‘Integer Value’ field for the analysis, so will enter a value for each of the polygons, and then save the table.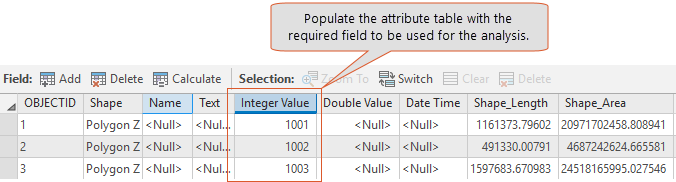
In the tool, use the ‘Integer Value’ field as the Zone field. Populate the rest of the parameters, specify the output and run with the ‘All’ Statistics type. The output table should appear something like below.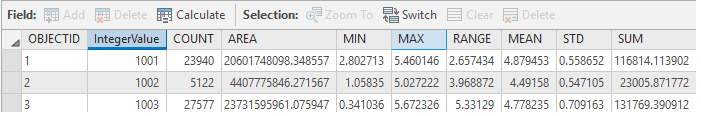
From this example, you learned about using the interactive features input capability in the Zonal Statistics as Table tool.
Apart from Zonal Statistics as Table, Interactive Feature Input is also supported in the following Spatial Analyst tools, grouped by toolset:
- Distance: Cost Allocation, Cost Back Link, Cost Connectivity, Cost Distance, Cost Path, Euclidean Allocation, Euclidean Direction, Euclidean Distance, Path Distance, Path Distance Allocation, Path Distance Back Link
- Extraction: Extract by Mask, Extract Multi Values to Points, Extract Values to Points, Sample
- Hydrology: Snap Pour Point, Watershed
- Interpolation: IDW, Spline with Barriers
- Multivariate: Create Signatures
- Solar Radiation: Points Solar Radiation, Solar Radiation Graphics
- Surface: Observer Points, Viewshed, Viewshed 2, Visibility
- Zonal: Tabulate Area, Zonal Geometry, Zonal Geometry as Table, Zonal Histogram and Zonal Statistics.
Now that you know how to use the interactive features, let’s recap a few things:
- Select the appropriate feature type (points, lines, polygons) from the interactive feature drop-down menu that is supported by the tool parameter. Multipatch is not supported by any of the Spatial Analyst tools, so the tool would fail if it is selected.
- After drawing some features clear the selection from the last created feature, so that all features are used in the analysis.
- If the tool requires any attribute to perform the analysis, add the attribute and save it. If you do not add attribute information and specify the field, the tool would either execute on the ObjectId or on some other field, depending on the default tool behavior. If the particular field chosen for your analysis contain null values, the tool would fail to execute.
- Pick the correct attribute field for executing your tool. Some tools like Zonal Statistics and Zonal Statistics as Table would fail if you do not specify the field on which you want to do the analysis.
To learn more about using interactive feature input with geoprocessing tools, explore the help documentation here. Additionally you can also explore a recent blog post, Streamline Your ArcGIS Pro Geoprocessing Workflows with Interactive Feature Inputs to gain further insights on interactive feature input.
You must be a registered user to add a comment. If you've already registered, sign in. Otherwise, register and sign in.