- Home
- :
- All Communities
- :
- Products
- :
- ArcGIS GeoStatistical Analyst
- :
- ArcGIS GeoStatistical Analyst Blog
- :
- New Subsetting Tool in Geostatistical Analyst: Gen...
New Subsetting Tool in Geostatistical Analyst: Generate Subset Polygons
- Subscribe to RSS Feed
- Mark as New
- Mark as Read
- Bookmark
- Subscribe
- Printer Friendly Page
- Report Inappropriate Content
A new subsetting algorithm has been developed in Geostatistical Analyst for ArcGIS Pro 2.1, Generate Subset Polygons, as a geoprocessing tool. The purpose of this tool is to break down the spatial data into small, nonoverlapping subsets.
The new tool is intended to be used to create Subset Polygons in EBK Regression Prediction and any future tools that allow you to define subsets using polygons.
Why do we need a new subsetting algorithm?
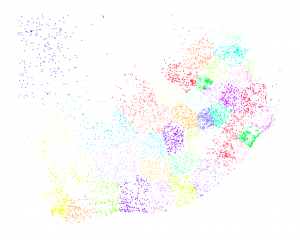
The current subsetting algorithm implemented in Empirical Bayesian Kriging (EBK) and EBK Regression Prediction often encounters problems with clustered data. For example, in the figure below, the current subsetting algorithm often combines data far away from each other into the same subset. This is not desirable because the subsets should be as compact as possible.
Figure 1: Overlapping subsetting polygon using EBK Regression Prediction, where the blue dots are the point location of rainfall stations and the selected polygon (cyan) shows the overlapping nature. The data for this analysis have been taken from [1].
The new algorithm
In the new algorithm, for each subset Si, the number of points ni satisfies the constraint min ≤ ni ≤max and minimizes the sum of the pairwise squared deviations within the subsets ∑i ∑x∈Si ∑y∈Si ||x-y||2. This could also be reorganized as the sum of weighted variances within the subsets 2∑i ni ∑x∈Si ||x- ci||2, where ci is the center of the subset Si. Note, this algorithm has a harsher penalty on the number of points in each subset as compared to the K-mean clustering.
The new algorithm performs the following three steps:
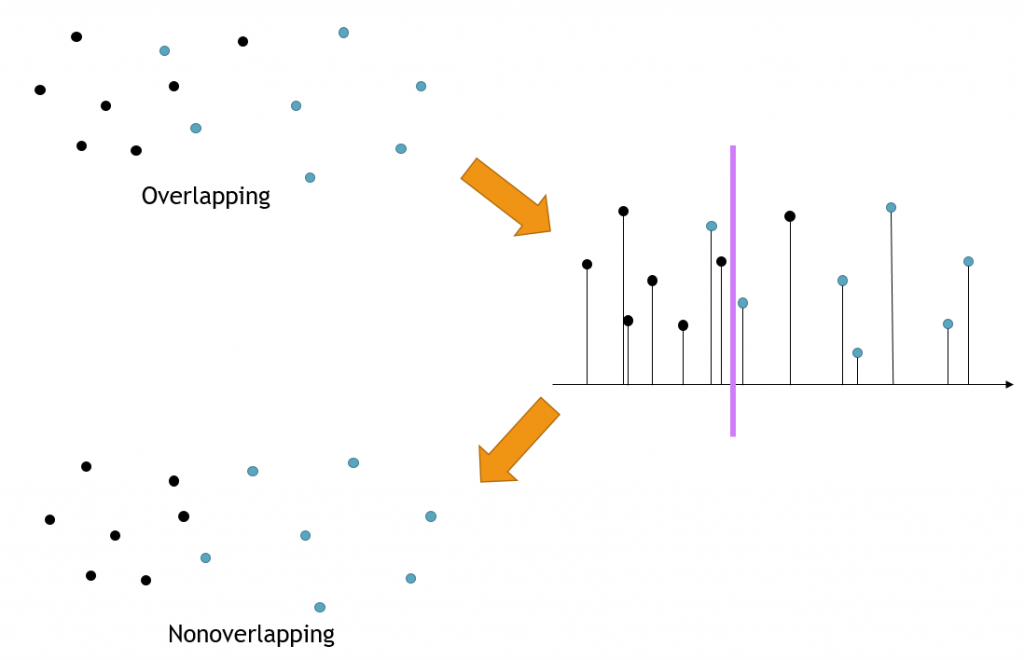
Step 1: Connects all points and form a closed curve.
Step 2: Cuts the curve into subsets.
Step 3: Finds all overlaps and resolves them.
Step 1
The first step connects all points and forms a closed curve. To achieve this, we form a grid in the work space and put all points that are regarded as clusters into corresponding grid cells.
Figure 2: Example of how the points are connected to form a closed curve.
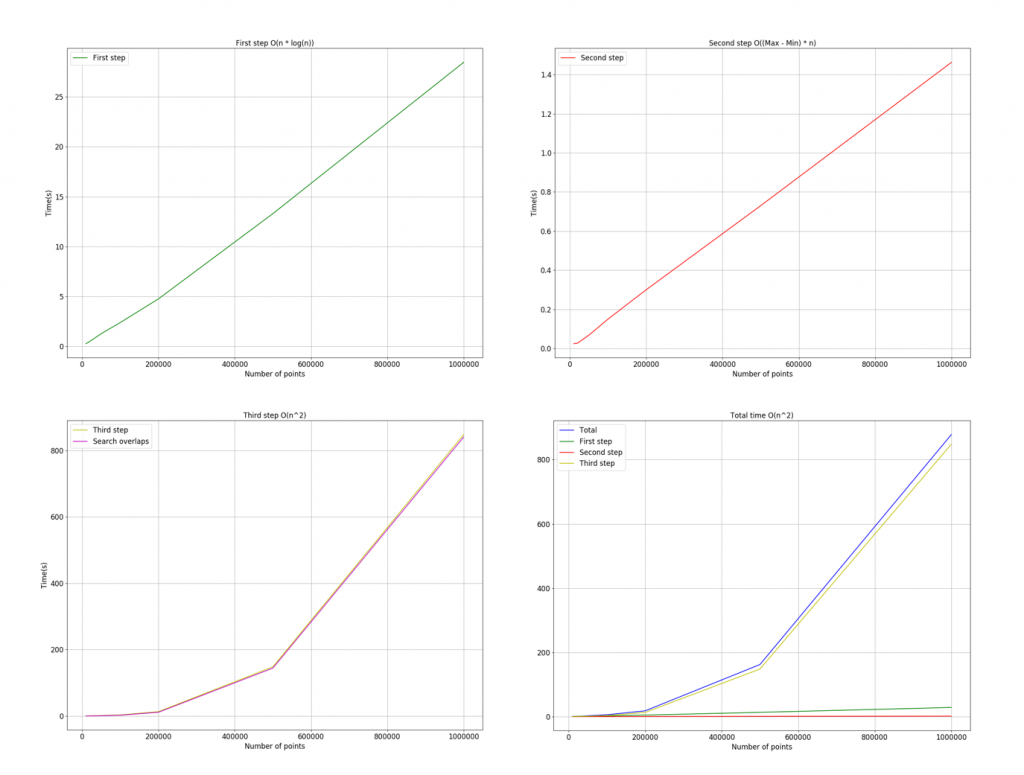
If two clusters are in the same cell, we merge them into one. A hash table is used to locate the clusters in the grid for efficient searching. We merge nearby clusters to form the curve. Initially, the cell size is extremely fine to ensure that points are connected locally. As the size of the cluster increases, the cell size also increases. The time complexity of this step is O(n · log n), where n is the total number of points.
Step 2
The second step cuts the curve into subsets. While cutting the curve, we satisfy the constraint on the number of points in each subset and minimize the sum of the pairwise squared deviations within the subsets. A dynamic programming algorithm is applied to solve this task. The complexity of the algorithm is O((max-min) · n).
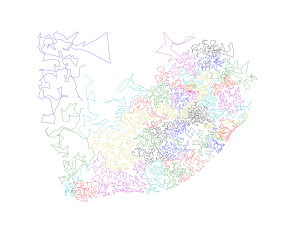
Figure 3: The curve is cut into subsets, where the number of points in each subset satisfies the minimum and maximum requirement, and the sum of the pairwise squared deviations within the subsets are minimized.
Step 3
The third step finds all overlaps and resolves them while further minimizing the sum of the pairwise squared deviations within the subsets. At present, we are using a brute force search in the third step, which accounts for most of the total execution time (with complexity O(n2)), to find overlapping subset pairs. The overlapping is resolved by finding a partitioning between the two subsets, minimizing the sum of the pairwise squared deviations within each subset, while maintaining the required minimum and maximum number of points in each subset. This is performed by projecting points to a set of directions in n-dimension covering the space evenly. For each projection, the optimal division can be found by a dynamic programming approach. Among all projections, the one with the minimum penalty is chosen. The algorithm iterates until no overlaps are detected or the number of iterations reaches the upper bound. The figure below shows a single overlap being removed.
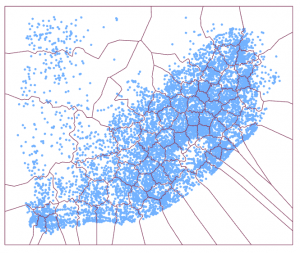
The new subsetting algorithm classifies each point into a subset (Figure 5) and creates polygons that wrap around each individual subset (Figure 6). Thus, for each polygon, all points inside the polygon belong to the same subset.
Figure 6: The non-overlapping subsets produces the final tool output which are represented by non-overlapping polygons.
Performance analysis of the new algorithm
Overall, the time complexity of the whole algorithm is O(n2), given the high computational complexity of searching for overlapped subsets.
The figure below shows the time complexity of the three steps as well as each function plotted on the same graph. In the current implementation, the third step takes the vast majority of the computation time for large numbers of points.
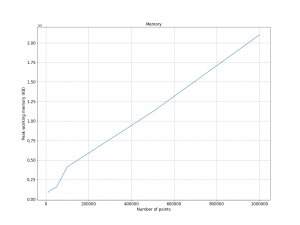
The space complexity of the algorithm is O(n), which means that the required memory is proportional to the number of points. The following image shows the memory allocation is linear with the number of input points.
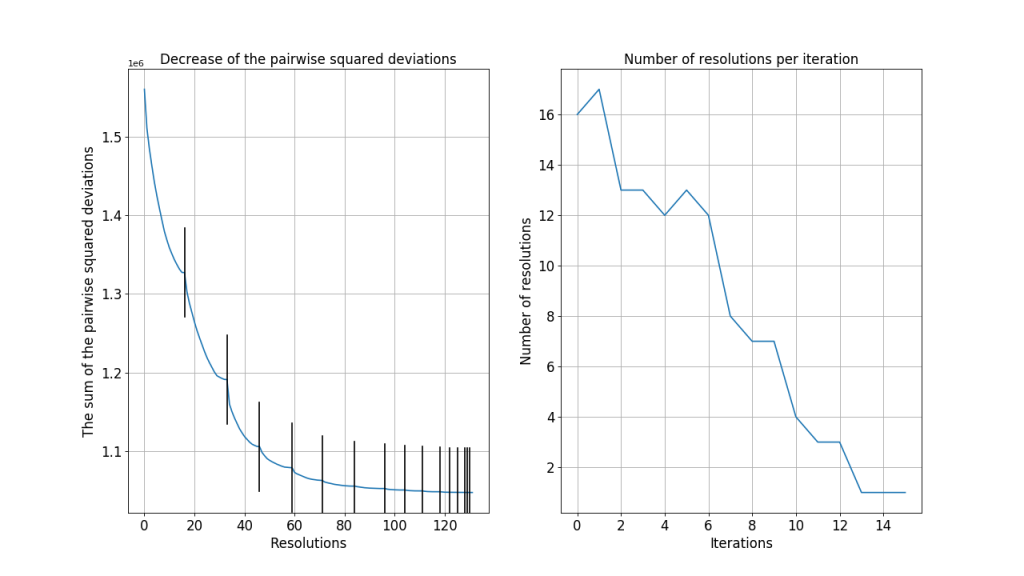
The following graphs show the analysis of the algorithm in the third step (resolution of overlapping subsets). When two subsets overlap, resolving their overlap reduces the total sum of the pairwise squared deviations. The graph on the left shows the decrease in the total sum after each resolution. The graphs on the right shows the number of resolutions in each iteration. For this data, the algorithm converges after about 14 iterations.
Application
This new subsetting algorithm can work efficiently with clustered datasets with more than a billion points. The quality of the constructed subsets in the new subsetting algorithm is often better than the algorithm currently used in EBK. Though it does not yet support 3D points, the methodology can be easily extended to multiple dimensions.
Part of this new subsetting algorithm and blog content was created by Zeren Shui, advised by Alexander Gribov, during his internship with the Geostatistical Analyst Team in summer 2017. Zeren is currently pursuing his Master’s degree in Data Science at College of Science and Engineering, University of Minnesota – Twin Cities. His research interests are Bayesian Statistics, Machine Learning, and Data Mining. For additional questions, you can comment here or contact him at shuix007@umn.edu.
References
[1] S. D. Lynch, Development of a raster database of annual, monthly and daily rainfall for southern Africa, WRC Report (1156/1/04) (2004) 78.
You must be a registered user to add a comment. If you've already registered, sign in. Otherwise, register and sign in.
![Figure 1: Overlapping subsetting polygon using EBK Regression Prediction, where the blue dots are the point location of rainfall stations and the selected polygon (cyan) shows the overlapping nature. The data for this analysis have been taken from [1].](https://blogs.esri.com/esri/arcgis/files/2018/12/Fig21-300x253.png)

