- Home
- :
- All Communities
- :
- Industries
- :
- Gas and Pipeline
- :
- Gas and Pipeline Blog
- :
- Managing Cathodic Protection with UPDM: The System
- Subscribe to RSS Feed
- Mark as New
- Mark as Read
- Bookmark
- Subscribe
- Printer Friendly Page
- Report Inappropriate Content
By Tom Coolidge and Tom DeWitte
Part 3 of 3
This the third and final blog in a series that explains how the ArcGIS platform with the ArcGIS Utility Network Management extension and the Utility and Pipeline Data Model (UPDM) can be utilized to model a cathodic protection system.
What is a cathodic protection zone and why does a pipe organization need to understand it?
Cathodic Protection Zones
What is a CP zone? In the second blog of this series we described the components which comprise a cathodic protection zone and how UPDM 2019 provides a template for organizing the information about those components. But, a cathodic protection zone is more than its components.
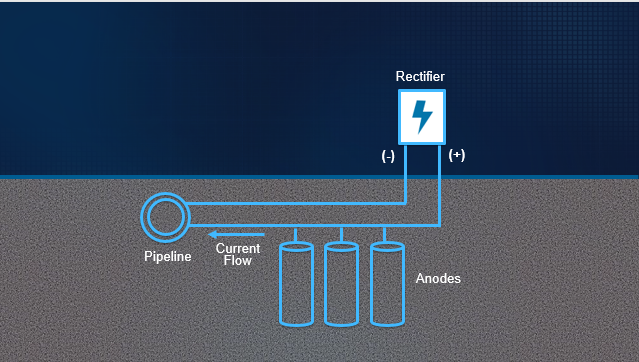
Cathodic Protection System
A cathodic protection zone is really an electrical circuit. Electricity flows through it to protect the connected components from corrosion. So, to understand what a cathodic protection zone is, we need an understanding of the connectivity between the components. But even that is not enough. In addition to understanding connectivity we need to understand what connected components have characteristics which will cause the flow of electricity to stop.
This means the GIS model representing the cathodic protection zone needs to know that plastic pipe is non-conducting and will therefore stop the flow of electricity. The GIS system needs to understand that devices and fittings can be insulated, and this will also stop the flow of electricity.
The ArcGIS Utility Network Management extension provides this higher level of understanding within ArcGIS.
Defining the Cathodic Protection Zone
To create a cathodic protection zone within the utility network, all PipelineLine, PipelineDevice and PipelineJunction features must have their CPTraceability populated. Additionally, the test points must be configured as terminals and designated as a subnetwork controller.
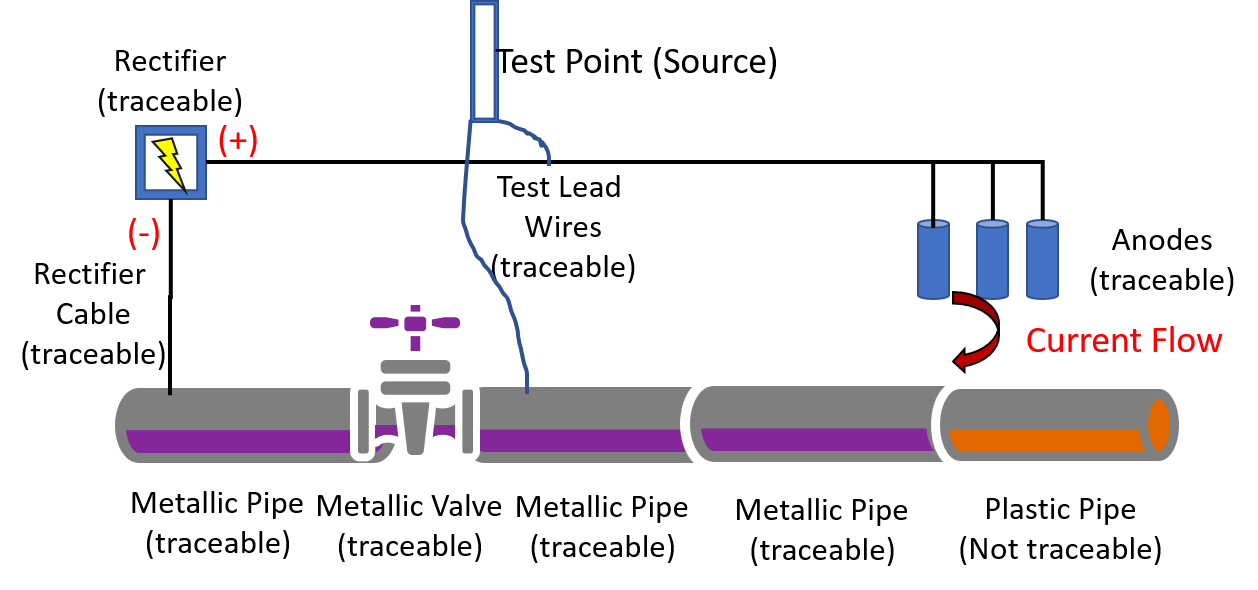
The logic that defines how the utility network discovers a cathodic protection zone is as follows:
- Start the trace from the sources (Test Point(s))
- Use the utility network connectivity to begin traversing the system.
- Stop traversing the network when the trace encounters a feature with a CPTraceability = Not Traceable.
The tool within the utility network which performs this task is the “Update Subnetwork” geoprocessing tool.
When the “Update Subnetwork” is run, it aggregates the following PipelineLine features to create the subnetwork geometry.
- Distribution lines
- Transmission lines
- Gathering lines
Additionally, the “Update Subnetwork” is preconfigured in UPDM 2019 to summarize the following information and write it to the subnetwork feature record.
- Number of Anodes
- Number of Rectifiers
- Number of Test Points
- Total Length
- Total Surface Area
Defining Flow for Cathodic Protection
In the digital world of flow analysis, there are two types of flow networks; source, and sink.
- SOURCE — A source is an origin of the resource delivered. For example, for a natural gas distribution system, sources of natural gas are the utility transfer meters within town border stations.
- SINK —A sink is the destination of the gathered resource. For example, when modeling the Mississippi river basin, the sink of the pipe network is the outflow into the Gulf of Mexico, just south of the city of New Orleans.
A pressure system is another example of a source flow system. The source of gas to the gas pressure zone is the regulator device. A single gas pressure zone will typically have multiple regulators feeding gas into the pressure zone.
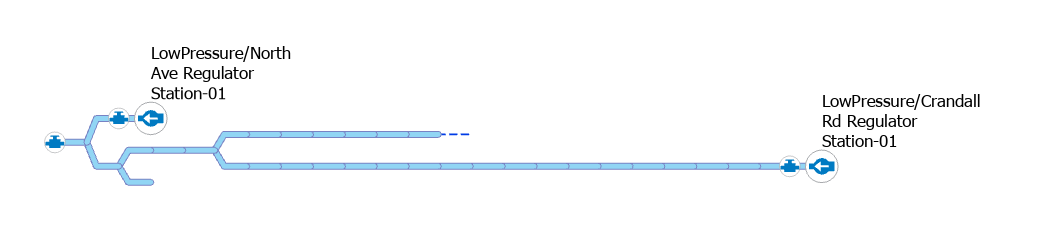
Diagram of Pressure Zone
Within the utility network, a single domain may only have one type of subnetwork controller (Source or Sink). The gas pipe system tiers (System, Pressure, Isolation) are modeled as sources. In UPDM 2019, the Pipeline domain models the subnetwork controller type as a “Source” to support the pipe system tiers.
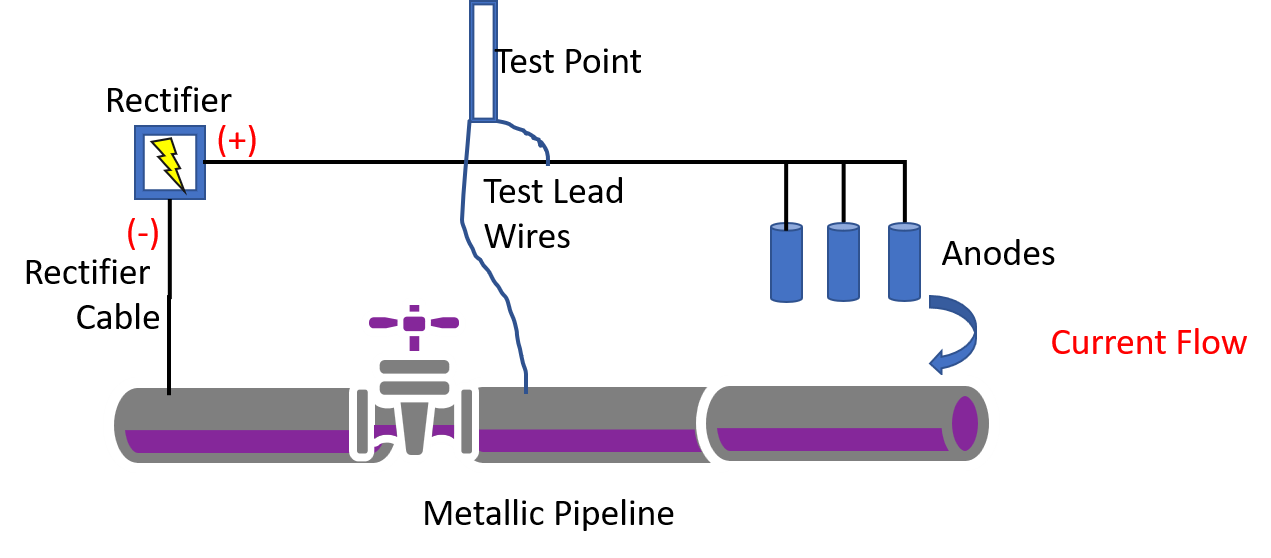
The cathodic protection system of a pipe system is not as consistent a flow model as the pressurized pipe system. For the impressed current system, the rectifier would be the logical source and the anode would be an intermediate device. For the galvanically protected system, the anode would be the logical source. Because of this inconsistency, it was decided that the best option was to make the test point the source as it is typically a part of both the galvanically protected system and the impressed current protection system.
Tracing Across a Cathodic Protection Zone
Now that the cathodic protection zones have been defined with the “Update Subnetwork” geoprocessing tool users can begin to perform traces across the cathodic protection system. Some common questions to ask the utility network via a trace are:
- Where is are the Test Points?
- Where is the nearest test point?
- Which pipe system components participate in the zone?
Outside of the trace tools simple attribute queries can be run to understand the following:
- Which pipe system components are bonded?
- Which pipe system components are cathodic protection insulators
With the cathodic protection zones defined in the utility network, these questions can be easily answered.
Conclusion
Data management and analysis of cathodic protection systems was a challenge in legacy geospatial systems. Entering the information has always been a straight forward process. Maintaining an intelligent representation of the cathodic protection system has historically been the challenge. With the utility network combined with the UPDM 2019 configuration, maintaining and analyzing a cathodic protection system is now an intuitive process.
If you missed the first two blogs in this series, we encourage you to check them out. The first blog provided an overview of how cathodic protection systems works to provide GIS professionals and IT administrators with enough knowledge to be able to correctly create a digital representation of a cathodic protection system utilizing UPDM 2019 and the utility network . The second blog went into detail on the use of UPDM 2019 to organize the digital presentation of the cathodic protection system.
PLEASE NOTE: The postings on this site are our own and don’t necessarily represent Esri’s position, strategies, or opinions
You must be a registered user to add a comment. If you've already registered, sign in. Otherwise, register and sign in.