- Home
- :
- All Communities
- :
- Industries
- :
- Gas and Pipeline
- :
- Gas and Pipeline Blog
- :
- Creating And Maintaining Multiple Models Using The...
- Subscribe to RSS Feed
- Mark as New
- Mark as Read
- Bookmark
- Subscribe
- Printer Friendly Page
- Report Inappropriate Content
By Tom Coolidge and Tom DeWitte
Gas utility and pipeline GIS data management is increasingly important. With a pipe network typically geographically widespread, topologically complex, and buried underground, the performance of many tasks and workflows, in a wide range of functional areas and roles, necessarily involves application software operating on a digital model of the pipe network and the surroundings through which it passes.
These models are only as good as the data available to them. Today’s pipe network GIS typically contains extensive and detailed information about each and every component of the physical network, what is going on within it, the natural and man-made surroundings through which the pipe network passes, and activity occurring around it.
Models most often are built from that data in one of two ways – depending upon whether the objective being examined is around “where is it located” or “how is it connected.” Linear referencing is the model building method for the first, connectivity modeling for the second. While both methods create a network model, they do it in different ways.
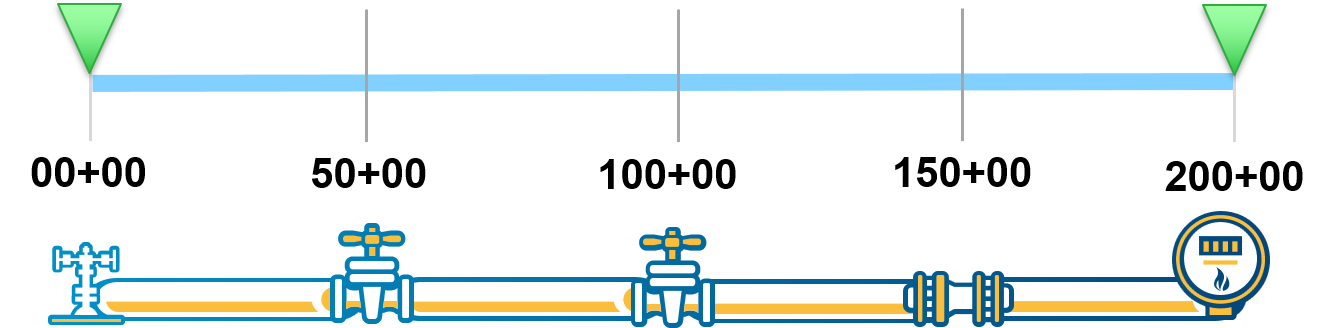
Before arrival of the shared centerline feature class with ArcGIS 10.8/Pro 2.5, pipe network modelers to satisfy both modeling needs had to create and maintain multiple digital mirror representations of their real pipe network. One of these was defined by linear referencing. Linear referencing is a language that expresses pipeline attribute and event locations in terms of measurements along a pipeline, from a defined starting point. The network model in Pipeline Referencing is established by the sequence of strictly increasing or decreasing measures on a continuous, unbroken non-branching run of physical pipe.
Another was defined by connectivity. Connectivity describes the state where two or more features either share a connectivity association, or the collection of features are geometrically coincident at an endpoint (or midspan at a vertex), and a connectivity rule exists that supports the relationship. For those to whom connectivity associations is a new term, they are used to model connectivity between two point features (Device or Junction) that are not necessarily geometrically coincident. An example of this in a pipe system is a flange bolted to a valve. There is no pipe component between the flange and the valve in the physical world. Now with connectivity associations in the utility network, this point to point connectivity can be correctly modeled in the digital world.
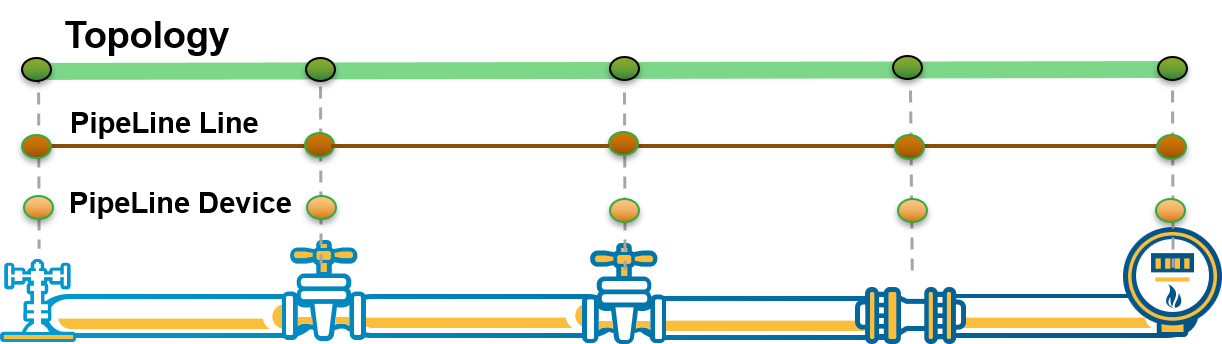
Traditionally, each of these ways was enabled by a separate set of data – one for linear referencing and another for connectivity modeling.
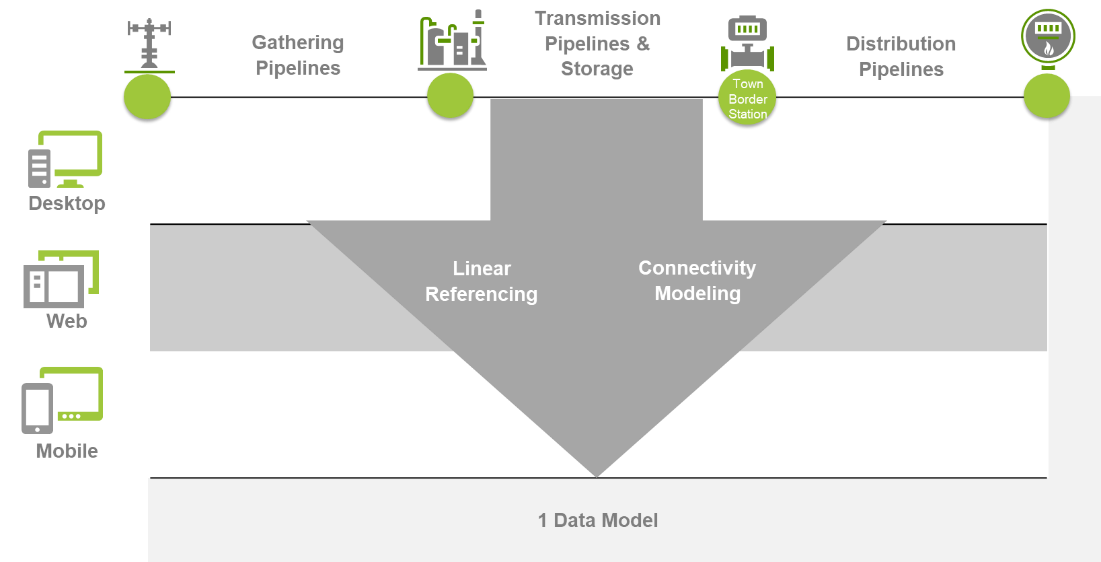
Multiple types of operators manage natural gas or hazardous liquids pipe networks and face the challenge of needing to create and maintain multiple models. One type is vertically-integrated gas companies. They span all or part of the way from the wellhead to the customer meter and typically operate an integrated pipe network that includes multiple subsystems – for example, transmission and distribution subsystems. Historically, these subsystems have been modeled separately.
Transmission pipelines also face the same challenge, not because they operate multiple subsystems, but because the range of application software their GIS needs to support requires access to both kinds of models.
Moreover, all types of operators are searching for better interoperability among software systems at the enterprise level. They also are experiencing the convergence of information technology and operations technology systems.
For all these reasons, a better solution to the need to create and maintain multiple digital models of the real pipe network is needed.
The Solution: Unified Pipe Data Management
Esri’s vision for pipe network operators is to create a single representation of the entire pipe network that mirrors the real network and can support both types of model building. This removes the traditional barriers between industry subsystems – for example, between transmission and distribution subsystems – that result in data silos. A single representation also enables users to work with that digital network just as they do with the real network. Linear referencing and connectivity modeling now can be performed on the same single network representation. We call this new data management capability: Unified Pipe Data Management.
The solution for vertically-integrated gas companies also is the solution for standalone transmission pipeline operators that, while they don’t operate multiple industry subsystems, have a need for both types of models to satisfy the data input requirements of the range of application software being supported by their GIS.
A single representation of the pipe network requires a unique data organization approach to store the entire pipe system—from wellhead to meter—and support the information model requirements of the ArcGIS Utility Network Management extension and Pipeline Referencing. Esri’s Utility & Pipeline Data Model (UPDM) 2019 is a data model template that provides this data organization.
Benefits Of Both Extensions Working On the Same Geodatabase
The ability for Pipeline Referencing and the ArcGIS Utility Network Management extensions to work on not just the same geodatabase but the same feature classes within the enterprise geodatabase, provides important benefits to pipe network operators. First, the two extensions bring important advancements in essential industry-specific data management into Esri’s core technology. This relieves the need for Esri business partners to fill capability gaps and frees them to extend the capabilities further and focus on adding value to uses of the data. At the same time, it gives pipe network operators the opportunity to mix and match application software built on ArcGIS from multiple Esri business partners. In addition, the ability for both extensions to work on the same geodatabase simplifies staff training, provides better management of high-pressure distribution pipe, and improves scalability and performance for operators of larger pipe networks.
Summary
For decades pipe organizations have had to either implement multiple models stored in separate data repositories or had to settle for one data management method over the other. With the release of ArcGIS 10.8/Pro 2.5, a single digital representation of the physical pipe system can be created and maintained. This reduces IT administration and support costs by allowing server systems and database licenses to be consolidated. For data editors, the process is simplified by providing a single editing experience regardless of where the edit occurs across the vertically-integrated pipe system. For end users, using the pipe system data is simpler because there is only one representation of the pipe system to work from.
One is better than more.
PLEASE NOTE: The postings on this site are our own and don’t necessarily represent Esri’s position, strategies, or opinions.
You must be a registered user to add a comment. If you've already registered, sign in. Otherwise, register and sign in.