- Home
- :
- All Communities
- :
- Industries
- :
- Gas and Pipeline
- :
- Gas and Pipeline Blog
- :
- Tracing through your pipe system
- Subscribe to RSS Feed
- Mark as New
- Mark as Read
- Bookmark
- Subscribe
- Printer Friendly Page
- Report Inappropriate Content
Finding those key buried devices and paths
By Tom Coolidge and Tom DeWitte
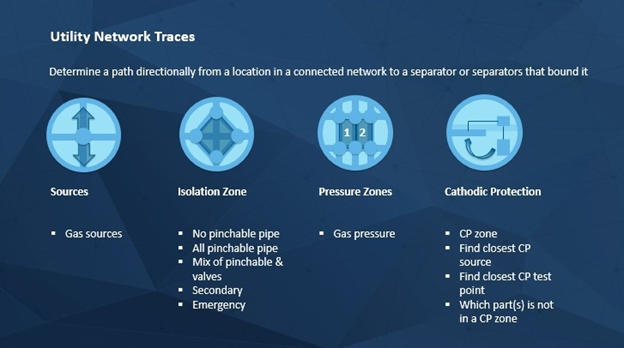
A gas utility or pipeline typically transports natural gas or hazardous liquids to customers through a large and complex network of interconnected pipes. In addition to pipe, these networks are comprised of an even larger number of other components, including fittings, valves, regulators and many more, some of which can affect the flow of the fluid through the pipes. Modeled properly, ArcGIS enables you to create a “digital twin” of all this complexity. This is key as many solutions require that you be able to determine a path directionally from a location in your connected network to a separator or separators that bound it. The utility network provides this capability.
It all starts with location. I find that as I get older, I am more frequently asking myself questions such as; where did I leave my glasses, or where is my phone. Resolving these questions usually entails me wandering about the house until I find those misplaced glasses or phone. Finding these items is not that difficult because I can see my glasses sitting on a table or I can see my phone as it sits on the kitchen counter where I left it.
Now imagine you work for a natural gas or hazardous liquids pipe organization, and all of the assets you are looking for are buried three or more feet below the surface. How do you go about finding a specific valve, fitting or cathodic protection anode? The short answer is maps. But, maps like traditional paper maps have their limitations in that when looking for a specific valve you must have a pretty good idea of where the valve is located in order to know what map sheet to look at, and where on that busy map sheet to look.
Digital maps are better, in that they allow you to search for a characteristic of the valve such as its assetID, manufacturer, size or type. But, a digital map also assumes you have some knowledge already about the valve you are looking for.
So, what do you do when your question is about the pipe network, and how a specific asset participates in the pipe network? This is where tools which understand how the assets connect to form the pipe network are required. This is where you need tracing tools to know your pipe system.
What type of questions can be answered with a trace?
When managing a pipe system there are many questions that get asked everyday which require an understanding of how the pipe system works. During an emergency, a very common and important question is: what valves do I need to close to isolate a section of the pipe network where damage or a leak has occurred? A common question asked by cathodic protection technicians is where is the nearest CP test point from my current location on the pipe system? Gas engineers who are evaluating a pressure zone ask the question; what are the regulator stations providing gas to this location?
What do I need to do to configure my gas system for tracing?
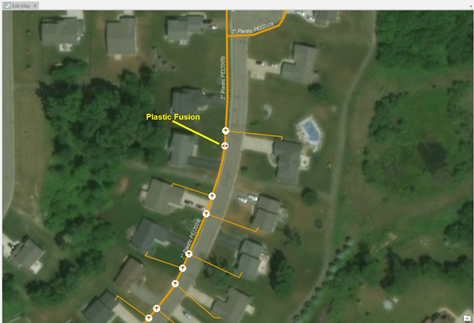
For a software system to be able to answer these common types of pipe system questions, an understanding of how the components of a pipe system connect is required. It is not enough to simply draw a digital representation of the asset on a map, such as is commonly done with CAD software. In addition to drawing the digital representation of the asset on a map, there also needs to be an understanding that the two polyethylene pipe segments which have been butt fusioned together are connected.
This software understanding of connectivity is network topology. Within the Esri ArcGIS platform, our latest version of network topology for utility systems is what we call the utility network.
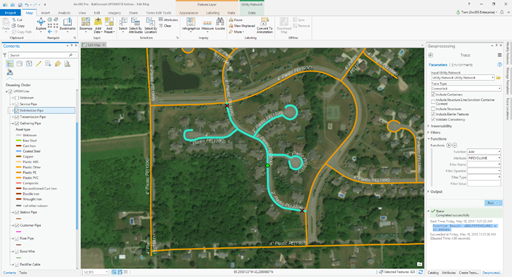
Can I perform a trace in ArcGIS Pro?
Yes. Tracing your network can be performed within ArcGIS Pro version 2.1 or later. Additionally, with the utility network being a service based solution, tracing can also be done with web applications, and eventually will be able to be performed by mobile applications.
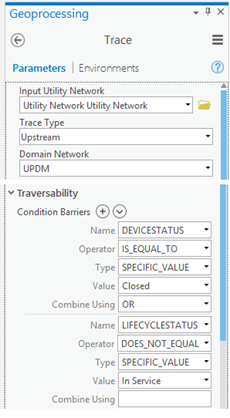
Within ArcGIS Pro, the options for configuring a trace have been significantly enhanced when compared to the ArcMap geometric network tools. It is now possible to dynamically answer questions by simple configuration of the properties of the trace tool. For example, if you are trying to determine the amount of gas or liquid lost due to a break in the pipe, you need to know the volume of the portion of the pipe network which was isolated. There is now a function property to the trace tool to allow you to summarize the total pipe volume of the trace selected pipe segments.
If you need to ask the question, what portion of my pipe system is upstream of a specified location, but only trace on those assets which are in production, and are open to allow the gas or liquid to pass through. The ArcGIS Pro trace tool now supports the ability to use designated asset attributes such as LifeCycleStatus, DeviceStatus, Pincheable, and Insulator Device to dynamically constrain which assets the trace can traverse. This, too, is a simple configuration of the tools parameters.
Since the trace tool is a geoprocessing tool, your preferred configuration properties can be saved as a model and shared across the organization.
How do I configure a trace to find the nearest asset?
Being able to find the nearest type of asset such as a regulator, valve, or CP test point, is another useful new addition to the capability of the trace tool.
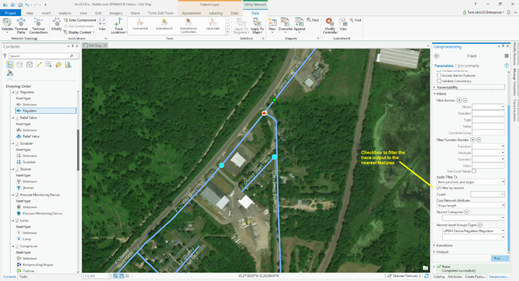
Simply checking a box within the filter options will constrain the trace output to the specified features which are closest based on the distance traversed across the pipe network.
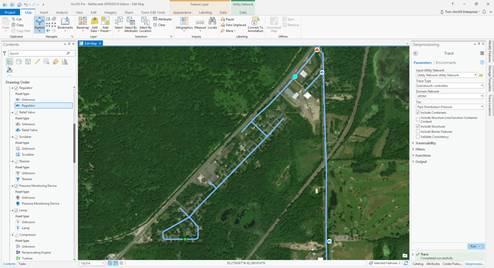
How do I configure the trace tool to find the sources feeding a gas subsystem?
The new trace tool within ArcGIS Pro contains some new trace options, such as subnetwork, subnetwork controller, shortest path, and loops. When a planner or engineer needs to find the regulators feeding a specified location, the subnetwork controller option makes this an easy question to ask of the pipe network.
Tracing with the new utility network solution provided by Esri, is unique in its ability to allow gas and hazardous liquids pipe companies to easily ask questions of their pipe networks. Databases alone cannot answer these questions. CAD systems cannot answer these questions. Even GIS systems which do not include network topology cannot answer these questions. Only a complete GIS system which includes network topology can answer these everyday questions about your pipe network. Only a network topology specifically built for management of utility systems such as a gas or hazardous liquids pipe network can provide the intelligent tools to help you know your system.
PLEASE NOTE: The postings on this site are my own
and don’t necessarily represent Esri’s position, strategies, or opinions.
You must be a registered user to add a comment. If you've already registered, sign in. Otherwise, register and sign in.