- Home
- :
- All Communities
- :
- Industries
- :
- Education
- :
- Education Blog
- :
- Fun with GIS 264: Designing Learning Experiences
Fun with GIS 264: Designing Learning Experiences
- Subscribe to RSS Feed
- Mark as New
- Mark as Read
- Bookmark
- Subscribe
- Printer Friendly Page
- Report Inappropriate Content
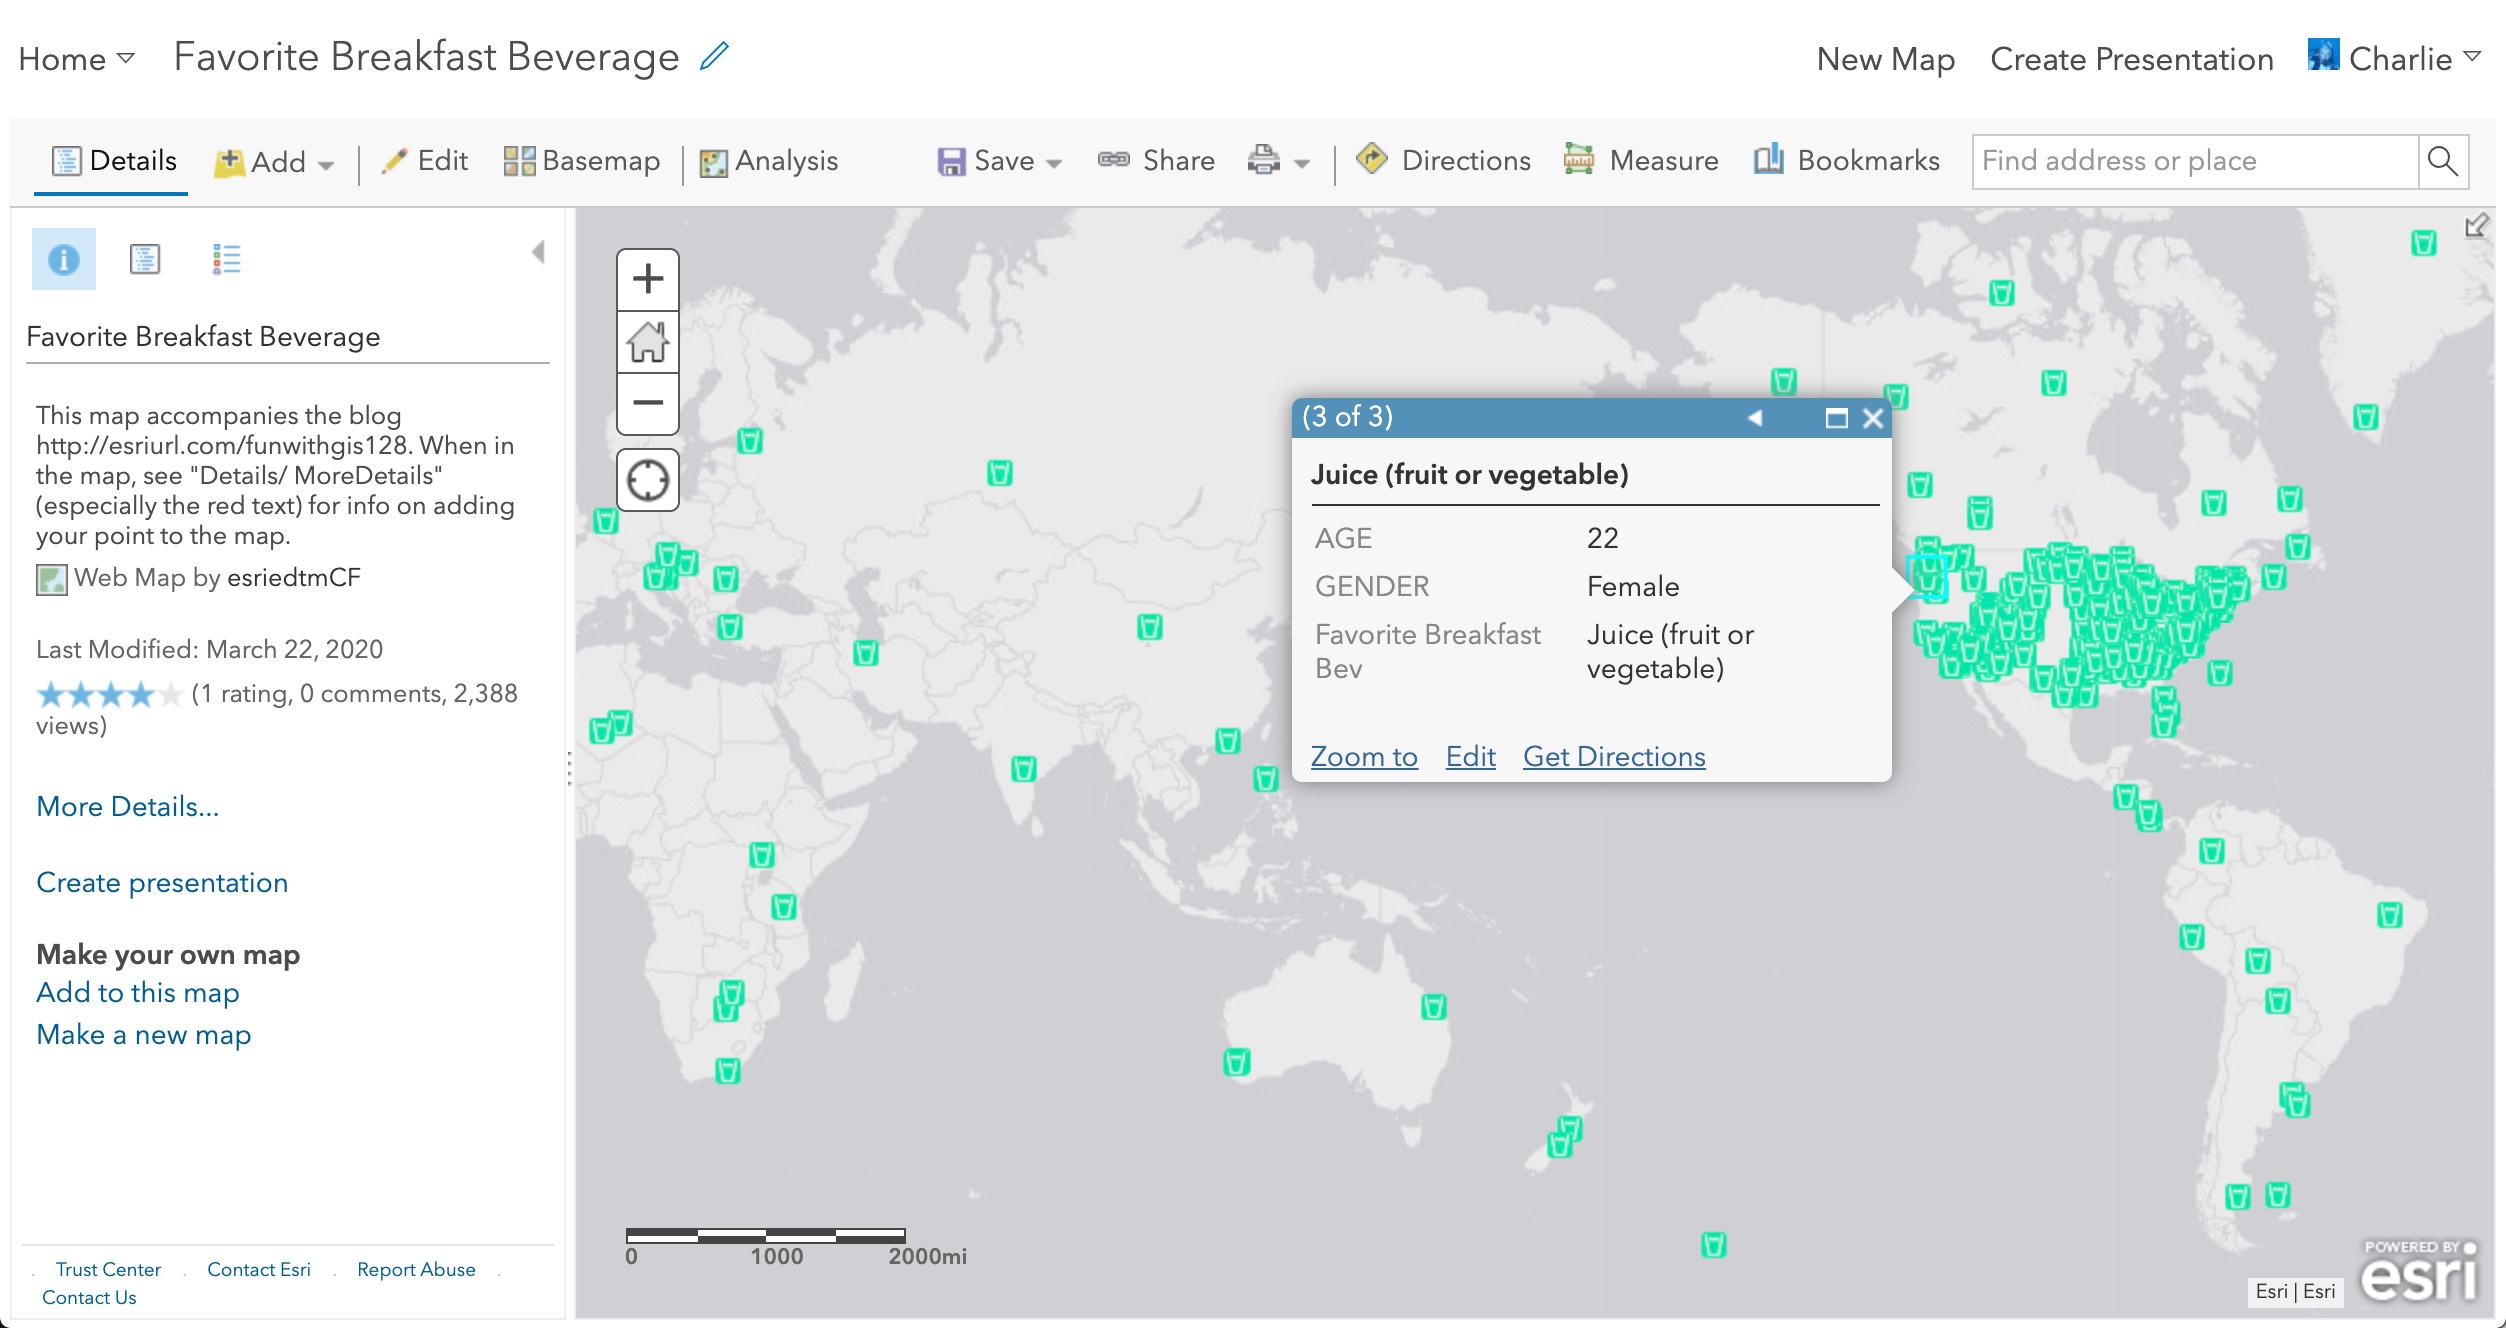
In summer 2012, teachers sufficiently skilled in desktop GIS could let an anonymous user create point data in an online map. I demonstrated this in the blog "Crowdsource Your Fieldwork," using a "breakfast beverage map."
At the time, it was exciting, but tedious; documenting the steps to create a feature service, publish it, make it accessible in an app, and test it required a lengthy doc. Today, creating a vastly better experience is really easy, all online, on a PC/Mac/Chrome device, for viewing and doing also on tablet or even smartphone, using Map Viewer, Survey123, Dashboard, and StoryMap ... tools provided free to schools in the ArcGIS School Bundle.

Especially in times of school disruption and social distancing, educators may find the process particularly engaging for learners (of any age), since they get to generate data and see their results quickly, and in different ways. Educators can experience this by recording your current situation via https://arcg.is/2xU1cjd, in a separate tab.
 Click to see StoryMap
Construction was a basic design experience: Conceive, sketch, build-test-tweak-repeat, release. The workflow in this case was:
- Conceive the end product (the storymap as the container, with a survey feeding a map feeding a dashboard). What end product data should users be able to explore? How will they be able to explore? What data need to be generated, in what format?
- Identify the products needed (the survey, the map, the dashboard, the story map) and the components to engage in each step.
- Build, in this case, as follows:
- Design the survey questions and choices, optimizing for "valuable data" (in a format the dashboard could make dance) and ease of use for the survey taker.
- Submit enough test data so each possible choice is engaged at least once.
- Set permissions of the survey.
- Generate a new map with the test survey data; symbolize the data, set the popups, set the bookmarks; save the map, share the map to a dashboard.
- Build the dashboard components, optimizing for power and interest; configure interactivity.
- Build the story map, optimizing for ease of use, engagement, and power.
- Share all components and test each step and link as an anonymous user.
- Delete all test data.
- Release and promote.
As usual, the hard part is conceiving the end product with enough clarity to build efficiently. It takes some familiarity with each of the tools in order to see how they work together, just like in cooking a family meal, planning an event, or building a doghouse benefit from some previous practice. Participate in/ View/ Study the story map and process above and see if you -- or, better yet, your students -- can replicate the process with something simple ... even just asking people their location, age, gender, and favorite breakfast beverage.
You must be a registered user to add a comment. If you've already registered, sign in. Otherwise, register and sign in.
-
Administration
38 -
Announcements
45 -
Career & Tech Ed
1 -
Curriculum-Learning Resources
179 -
Education Facilities
24 -
Events
47 -
GeoInquiries
1 -
Higher Education
519 -
Informal Education
266 -
Licensing Best Practices
46 -
National Geographic MapMaker
11 -
Pedagogy and Education Theory
187 -
Schools (K - 12)
282 -
Schools (K-12)
185 -
Spatial data
24 -
STEM
3 -
Students - Higher Education
231 -
Students - K-12 Schools
86 -
Success Stories
22 -
TeacherDesk
1 -
Tech Tips
83
- « Previous
- Next »