- Home
- :
- All Communities
- :
- Industries
- :
- Education
- :
- Education Blog
- :
- Fun with GIS 261: Teaching, GIS, and Coronavirus
Fun with GIS 261: Teaching, GIS, and Coronavirus
- Subscribe to RSS Feed
- Mark as New
- Mark as Read
- Bookmark
- Subscribe
- Printer Friendly Page
- Report Inappropriate Content
Science relies on facts. We may differ in interpretations, but we should be able to agree on facts … gravity, temperature, numbers of items in a set, and so on. Facts are scientifically observable and describable by others.
Asked about a news item, one of my high school teachers asked "Is he lying if he points to his legs and says 'blood flows up one leg and down the other'? No, he is not, but neither is he wholly truthful, so you have to take time to listen and think carefully … decide what is not true, what is true but incomplete, and what is complete … and then act." Years later, teaching social studies, I asked my students to be Sherlock Holmes, be scientific, seek all the relevant facts, shape their interpretations to best fit the facts instead of the reverse, say what they saw/ heard/ understood, and why they made a certain decision, based on facts. Working with GIS helps one see, hear, and understand situations through multiple layers, patterns, relationships, and perspectives.
The world faces staggering challenges. We must rely on facts, science, data from credible sources, and methodologies of experts. Everyone should be able to explain how facts were determined, and how interpretations were reached, just like my students and I did with each other. We need to seek a holistic picture, unlike the proverbial blind men at different portions of an elephant describing the creature as a large fan, a wall, a tree trunk, and so on.
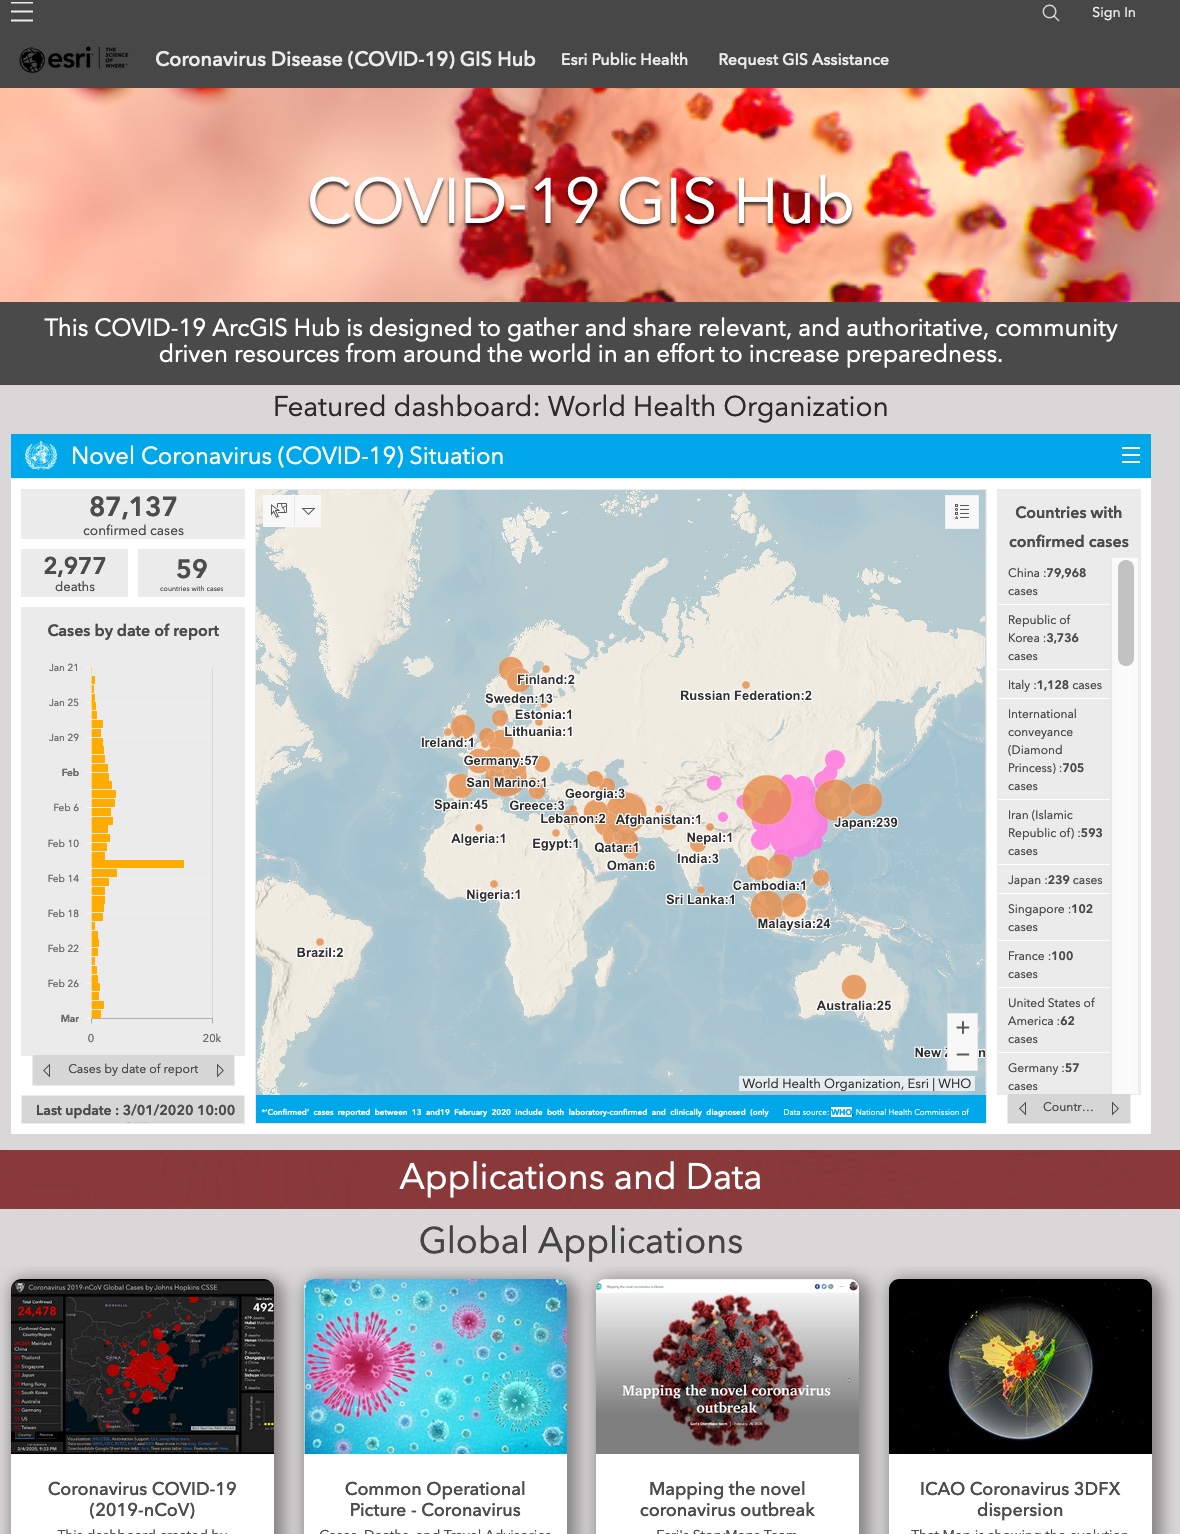
Case in point: the rapidly accelerating newest challenge: COVID-19 Coronavirus. In our ultra-connected world, it can race from country to country in less than a day. To combat it, we need an even more viral resource: knowledge, based on facts and science, which can spread at the speed of light. Unfortunately, so too can misinformation, which has the distinct advantage of not requiring painstaking assembly.
Esri has opened a new public website, the COVID-19 GIS Hub, linking content from experts: dashboards, applications, storymaps, data sets, news, relevant articles, and select social media. Of these, a key item for educators is the blogpost "Mapping coronavirus, responsibly." Maps are interpretations of data, meaning cartographers make decisions, and should map responsibly. Especially important for educators is that responsible producers of content tend to be critical thinkers about content from others, and vice versa; people who design interpretations learn about traps, why to avoid them, and how some take advantage of them, and become more critical consumers of information. Educators anxious to build critical thinkers and content consumers would do well to engage students in constructing, analyzing, and evaluating such content themselves. The necessary tools are free to schools for instructional use, around the world, in the ArcGIS School Bundle.
You must be a registered user to add a comment. If you've already registered, sign in. Otherwise, register and sign in.
-
Administration
38 -
Announcements
44 -
Career & Tech Ed
1 -
Curriculum-Learning Resources
178 -
Education Facilities
24 -
Events
47 -
GeoInquiries
1 -
Higher Education
518 -
Informal Education
265 -
Licensing Best Practices
46 -
National Geographic MapMaker
10 -
Pedagogy and Education Theory
187 -
Schools (K - 12)
282 -
Schools (K-12)
184 -
Spatial data
24 -
STEM
3 -
Students - Higher Education
231 -
Students - K-12 Schools
85 -
Success Stories
22 -
TeacherDesk
1 -
Tech Tips
83
- « Previous
- Next »